CarMax 2011 Annual Report Download - page 70
Download and view the complete annual report
Please find page 70 of the 2011 CarMax annual report below. You can navigate through the pages in the report by either clicking on the pages listed below, or by using the keyword search tool below to find specific information within the annual report.-
 1
1 -
2
-
3
-
4
-
5
-
6
-
7
-
8
-
9
-
10
-
11
-
12
-
13
-
14
-
15
-
16
-
17
-
18
-
19
-
20
-
21
-
22
-
23
-
24
-
25
-
26
-
27
-
28
-
29
-
30
-
31
-
32
-
33
-
34
-
35
-
36
-
37
-
38
-
39
-
40
-
41
-
42
-
43
-
44
-
45
-
46
-
47
-
48
-
49
-
50
-
51
-
52
-
53
-
54
-
55
-
56
-
57
-
58
-
59
-
 60
60 -
 61
61 -
 62
62 -
 63
63 -
 64
64 -
 65
65 -
 66
66 -
 67
67 -
 68
68 -
 69
69 -
 70
70 -
 71
71 -
 72
72 -
 73
73 -
 74
74 -
 75
75 -
 76
76 -
 77
77 -
 78
78 -
 79
79 -
 80
80 -
81
-
82
-
83
-
84
-
85
-
86
-
87
-
88
-
89
-
90
-
91
-
92
-
93
-
94
-
95
-
96
-
97
-
98
-
99
-
100
 |
 |

60
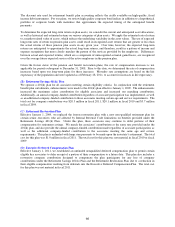
to limit risk for investors in the warehouse facilities. Our derivatives are not exchange-traded and are over-the-
counter customized derivative instruments. All of our derivative exposures are with highly rated bank
counterparties.
We measure derivative fair values assuming that the unit of account is an individual derivative instrument and that
derivatives are sold or transferred on a stand-alone basis. We estimate the fair value of our derivatives using quotes
determined by the derivative counterparties and third-party valuation services. We validate certain quotes using our
own internal models. Quotes from third-party valuation services, quotes received from bank counterparties and our
internal models project future cash flows and discount the future amounts to a present value using market-based
expectations for interest rates and the contractual terms of the derivative instruments. Because model inputs can
typically be observed in the liquid market and the models do not require significant judgment, these derivatives are
classified as Level 2.
Our derivative fair value measurements consider assumptions about counterparty and our own nonperformance risk.
We monitor counterparty and our own nonperformance risk and, in the event that we determine that a party is
unlikely to perform under terms of the contract, we would adjust the derivative fair value to reflect the
nonperformance risk.
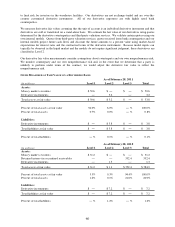
ITEMS MEASURED AT FAIR VALUE ON A RECURRING BASIS
(In millions)
Assets:
Money market securities 50.6$ ―$ ―$ 50.6$
Derivative instruments ― 3.2 ― 3.2
Total assets at fair value 50.6$ 3.2$ ―$ 53.8$
Percent of total assets at fair value 94.0% 6.0% ―% 100.0%
Percent of total assets 0.7% 0.0% ―% 0.8%
Liabilities:
Derivative instruments ―$ 3.8$ ―$ 3.8$
Total liabilities at fair value ―$ 3.8$ ―$ 3.8$
Percent of total liabilities ―% 0.1% ―% 0.1%
Total
Level 3
Level 2
As of February 28, 2011
Level 1
(In millions)
Assets:
Money market securities 31.2$ ―$ ―$ 31.2$
Retained interest in securitized receivables ― ― 552.4 552.4
Derivative instruments ― 1.3 ― 1.3
Total assets at fair value 31.2$ 1.3$ 552.4$ 584.9$
Percent of total assets at fair value 5.3% 0.3% 94.4% 100.0%
Percent of total assets 1.2% 0.1% 21.6% 22.9%
Liabilities:
Derivative instruments ―$ 7.2$ ―$ 7.2$
Total liabilities at fair value ―$ 7.2$ ―$ 7.2$
Percent of total liabilities ―% 1.2% ―% 1.2%
As of February 28, 2010
Level 1
Level 2
Level 3
Total