CarMax 2011 Annual Report Download - page 3
Download and view the complete annual report
Please find page 3 of the 2011 CarMax annual report below. You can navigate through the pages in the report by either clicking on the pages listed below, or by using the keyword search tool below to find specific information within the annual report.-
 1
1 -
 2
2 -
 3
3 -
 4
4 -
 5
5 -
 6
6 -
 7
7 -
 8
8 -
 9
9 -
 10
10 -
 11
11 -
 12
12 -
 13
13 -
 14
14 -
15
-
16
-
17
-
18
-
19
-
20
-
21
-
22
-
23
-
24
-
25
-
26
-
27
-
28
-
29
-
30
-
31
-
32
-
33
-
34
-
35
-
36
-
37
-
38
-
39
-
40
-
41
-
42
-
43
-
44
-
45
-
46
-
47
-
48
-
49
-
50
-
51
-
52
-
53
-
54
-
55
-
56
-
57
-
58
-
59
-
60
-
61
-
62
-
63
-
64
-
65
-
66
-
67
-
68
-
69
-
70
-
71
-
72
-
73
-
74
-
75
-
76
-
77
-
78
-
79
-
80
-
81
-
82
-
83
-
84
-
85
-
86
-
87
-
88
-
89
-
90
-
91
-
92
-
93
-
94
-
95
-
96
-
97
-
98
-
99
-
100
 |
 |

CarMax 2011 1
While pleased with our recent achievements, we
believe that we can continue to improve every aspect
of our business. As we look to the future, we are
excited about initiatives underway to make more of
the car-buying process available to customers online.
We recently implemented CarMax EasyShop in two
test stores. This initiative gives customers a fast and
fl exible online alternative for some of the most time-
consuming aspects of buying a car. Using CarMax
EasyShop, customers can put a car on hold, set up an
appointment, order and pay for a transfer of a vehicle
from another CarMax store, apply for fi nancing, select
a MaxCare plan and get a jump on much of the
paperwork. We look forward to continuing to fi nd
more ways to make car-buying the way it should be.
In closing, I want to again thank our associates,
customers and shareholders for their continuing sup-
port. I cannot give enough credit to all the associates
who play pivotal roles in our success as we continue
Building a Better CarMax and who are the foundation
of our long-term performance. Their unwavering com-
mitment to customer service allowed us to not just
survive the recession but to emerge an even stronger
company. I am proud to be part of this winning team.
these efforts, while simultaneously realizing a steady
improvement in vehicle quality scores. This represents
roughly $100 million of savings that are available to
optimize our sales and profi tability.
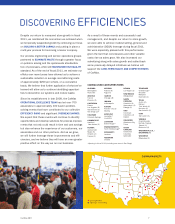
During the year, we resumed geographic growth, open-
ing three stores in Augusta, Cincinnati and Dayton, all
of which are new markets for CarMax. We are actively
working to fi ll the real estate pipeline and build the
management bench necessary to support future
store growth. Currently, we expect to open fi ve stores
in fi scal 2012 and between eight and ten stores in
fi scal 2013. We remain confi dent that we are well
positioned for growth. Despite being by far the larg-
est retailer of used cars in the U.S., we estimate our
share of the late-model used vehicle market is less
than 3%. With just 103 used car superstores at year
end, we were in markets representing less than half
the U.S. population. We believe geographic expansion
and additional fi ll-in opportunities in existing markets
should fuel our growth for years to come.
We closed fi scal 2011 with a healthy balance sheet
and the liquidity to support our growth plans. During
the year, CarMax Auto Finance took several steps to
mitigate the risk of future dislocations in the credit
markets, including establishing a second warehouse
facility with a staggered renewal date and increasing
the overall warehouse capacity. In addition, we took
steps that we believe give our third-party fi nance pro-
viders an even better appreciation of the advantages
of our unique fi nance origination channel.
Tom Folliard
President and Chief Executive Offi cer
April 27, 2011
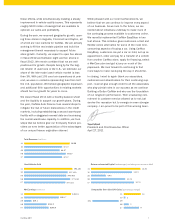
Total Revenues (in billions)
$7.47
$8.98
$8.20
$6.97
$7.47
11
10
09
08
07
345,465
377,244
337,021
396,181
357,129
11
10
09
08
07
Used Vehicles Sold
11
10
09
08
07
$59.2
$182.0
$198.6
$380.9
Net Earnings (in millions)
$281.7
Return on Invested Capital (unleveraged, excluding non-recourse debt)
4.4%
10.1%
12.7%
14.6%
12.1%
11
10
09
08
07
(16)
1
9
3
10
Comparable Store Used Unit Sales (percentage change)
11
10
09
08
07