CarMax 2011 Annual Report Download - page 30
Download and view the complete annual report
Please find page 30 of the 2011 CarMax annual report below. You can navigate through the pages in the report by either clicking on the pages listed below, or by using the keyword search tool below to find specific information within the annual report.-
 1
1 -
2
-
3
-
4
-
5
-
6
-
7
-
8
-
9
-
10
-
11
-
12
-
13
-
14
-
15
-
16
-
17
-
18
-
19
-
 20
20 -
 21
21 -
 22
22 -
 23
23 -
 24
24 -
 25
25 -
 26
26 -
 27
27 -
 28
28 -
 29
29 -
 30
30 -
 31
31 -
 32
32 -
 33
33 -
 34
34 -
 35
35 -
 36
36 -
 37
37 -
 38
38 -
 39
39 -
 40
40 -
41
-
42
-
43
-
44
-
45
-
46
-
47
-
48
-
49
-
50
-
51
-
52
-
53
-
54
-
55
-
56
-
57
-
58
-
59
-
60
-
61
-
62
-
63
-
64
-
65
-
66
-
67
-
68
-
69
-
70
-
71
-
72
-
73
-
74
-
75
-
76
-
77
-
78
-
79
-
80
-
81
-
82
-
83
-
84
-
85
-
86
-
87
-
88
-
89
-
90
-
91
-
92
-
93
-
94
-
95
-
96
-
97
-
98
-
99
-
100
 |
 |
20
and vehicle returns, CAF financed approximately 30% of our retail vehicle unit sales in fiscal 2011. As of
February 28, 2011, CAF serviced more than 380,000 customers in its $4.33 billion portfolio.
We sell ESPs and GAP on behalf of unrelated third parties who are the primary obligors. As of February 28, 2011,
the used vehicle third-party ESP providers were CNA National Warranty Corporation and The Warranty Group, and
the third-party GAP provider was Safe-Guard Products International, LLC. We have no contractual liability to the
customer under these third-party plans. ESP revenue represents commissions received on the sale of ESPs and GAP
from the unrelated third parties.
Over the long term, we believe the primary drivers for earnings growth will be vehicle unit sales growth, from both
new stores and stores included in our comparable store base, as well as improvements in margins resulting from
operational efficiencies. We target a dollar range of gross profit per used unit sold. The gross profit dollar target for
an individual vehicle is based on a variety of factors, including its probability of sale and its mileage relative to its
age; however, it is not primarily based on the vehicle’s selling price.
As a result of the weak economic and sales environment, in December 2008, we temporarily suspended store
growth. This suspension reduced our capital needs and growth-related costs. Based on improvements in our sales
and profitability in fiscal 2010, as well as increased stability in the credit markets, we resumed store growth in fiscal
2011, opening three superstores. We plan to open five superstores in fiscal 2012 and between eight and ten
superstores in fiscal 2013. We are in the process of the national rollout of our retail concept, and as of
February 28, 2011, we had used car superstores located in markets that comprised approximately 48% of the U.S.
population.
The principal challenges we face in expanding our store base include our ability to build our management bench
strength to support our store growth and our ability to procure suitable real estate at favorable terms. We strive to
staff each newly opened store with an experienced management team. Therefore, we must recruit, train and develop
managers and associates to fill the pipeline necessary to support future store openings.
Fiscal 2011 Highlights
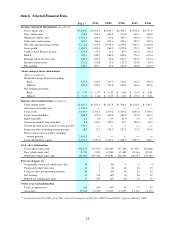
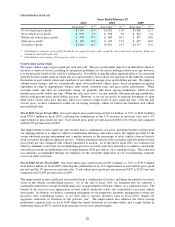
Net sales and operating revenues increased 20% to $8.98 billion from $7.47 billion in fiscal 2010, while net
earnings increased 35% to $380.9 million, or $1.67 per share, from $281.7 million, or $1.26 per share.
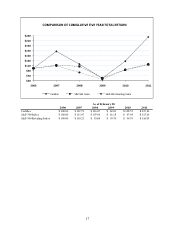
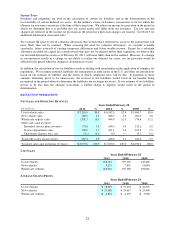
Total used vehicle revenues increased 16% to $7.21 billion versus $6.19 billion in fiscal 2010. Total used
vehicle unit sales rose 11%, reflecting the combination of a 10% increase in comparable store used unit sales
and sales from newer stores not yet included in the comparable store base. The average used vehicle selling
price climbed 5%, primarily reflecting increases in our acquisition costs, which were affected by a year-over-
year increase in used vehicle wholesale values.
Total wholesale vehicle revenues increased 54% to $1.30 billion versus $844.9 million in fiscal 2010, reflecting
the combination of a 33% increase in wholesale unit sales and a 16% rise in the average wholesale vehicle
selling price. Wholesale unit sales benefited from increases in both appraisal traffic and a higher appraisal buy
rate.
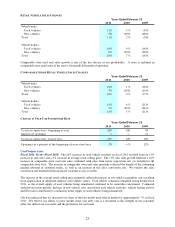
Total gross profit increased 18% to $1.30 billion compared with $1.10 billion in fiscal 2010, primarily
reflecting the increases in used and wholesale unit sales. Gross profit also benefited from a 7% improvement in
total gross profit retail per unit, which climbed $207 to $3,218 per unit from $3,011 per unit in fiscal 2010.
Several factors contributed to the strength of our gross profit per unit, including our ongoing initiative to reduce
waste in the vehicle reconditioning process; the support provided by the strong wholesale market valuations and
a modest increase in the percentage of used vehicles sourced directly from consumers via our appraisal process.
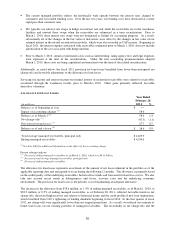
CAF income was $220.0 million compared with $175.2 million in fiscal 2010. In fiscal 2011, CAF income
reflected the historically high spreads between interest rates charged to consumers and CAF’s funding costs. In
the first quarter of fiscal 2011, net charge-offs were significantly lower than our original projections. As a
result, we reduced our estimate of future loan losses on our existing portfolio of managed receivables. The
favorability in net charge-offs and the resulting adjustment to the allowance for loan losses positively affected
net income by approximately $0.03 per share versus our expectations. In fiscal 2010, CAF income was
increased by adjustments totaling $26.7 million, or $0.07 per share, related to loans originated in previous years.
Selling, general and administrative (“SG&A”) expenses increased 11% to $905.1 million from $818.7 million
in fiscal 2010. The increase primarily reflected increases in sales commissions and other variable costs
associated with the growth in unit sales and higher advertising expense, as well as costs associated with our
resumption of store growth. In addition, fiscal 2010 SG&A expenses included the benefit of a favorable