CarMax 2011 Annual Report Download - page 40
Download and view the complete annual report
Please find page 40 of the 2011 CarMax annual report below. You can navigate through the pages in the report by either clicking on the pages listed below, or by using the keyword search tool below to find specific information within the annual report.-
 1
1 -
2
-
3
-
4
-
5
-
6
-
7
-
8
-
9
-
10
-
11
-
12
-
13
-
14
-
15
-
16
-
17
-
18
-
19
-
20
-
21
-
22
-
23
-
24
-
25
-
26
-
27
-
28
-
29
-
 30
30 -
 31
31 -
 32
32 -
 33
33 -
 34
34 -
 35
35 -
 36
36 -
 37
37 -
 38
38 -
 39
39 -
 40
40 -
 41
41 -
 42
42 -
 43
43 -
 44
44 -
 45
45 -
 46
46 -
 47
47 -
 48
48 -
 49
49 -
 50
50 -
51
-
52
-
53
-
54
-
55
-
56
-
57
-
58
-
59
-
60
-
61
-
62
-
63
-
64
-
65
-
66
-
67
-
68
-
69
-
70
-
71
-
72
-
73
-
74
-
75
-
76
-
77
-
78
-
79
-
80
-
81
-
82
-
83
-
84
-
85
-
86
-
87
-
88
-
89
-
90
-
91
-
92
-
93
-
94
-
95
-
96
-
97
-
98
-
99
-
100
 |
 |

30
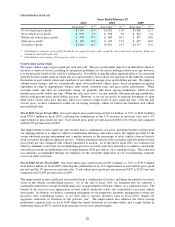
The current managed portfolio reflects the historically wide spreads between the interest rates charged to
consumers and our related funding costs. Over the last two years, our funding costs have decreased at a more
rapid pace than consumer rates.
We typically use interest rate swaps to hedge our interest rate risk while the receivables are in the warehouse
facilities and unwind these swaps when the receivables are refinanced in a term securitization. Prior to
March 1, 2010, these interest rate swaps were not designated as hedges for accounting purposes. As a result,
substantially all of the changes in the fair value of derivatives were offset by the changes in fair value of our
retained interest in the related securitized receivables, which were also recorded in CAF income. Beginning in
fiscal 2011, the interest expense associated with receivables originated prior to March 1, 2010, does not include
amortization of the cost associated with hedge unwinds.
Prior to March 1, 2010, certain securitization costs such as underwriting, rating agency fees and legal expenses
were expensed at the time of the securitizations. Under the new accounting pronouncements adopted
March 1, 2010, these costs are being capitalized and amortized over the term of the related securitizations.
Additionally, as noted below, the fiscal 2011 provision for loan losses benefited from lower-than-anticipated net
charge-offs and favorable adjustments to the allowance for loan losses.
Servicing fee income and interest income on retained interest in securitized receivables were related to receivables
securitized through the warehouse facility prior to March 1, 2010. Other gains primarily reflected favorable
derivative valuations.
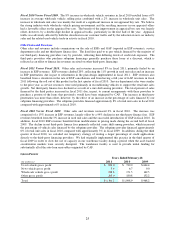
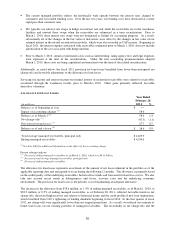
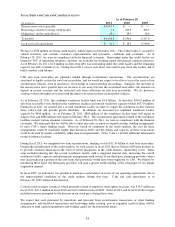
ALLOWANCE FOR LOAN LOSSES
(In millions) 2011 %
Balance as of beginning of year ―$
Impact of accounting change (1) 58.6
Balance as of March 1 (2) 58.6 1.4
Net charge-offs (3) (47.5) (1.1)
Provision for loan losses (3) 27.7 0.7
Balance as of end of year (4) 38.9$ 0.9
Total average managed receivables, principal only 4,229.9$
Ending managed receivables 4,334.6$
Year Ended
February 28
(1) See Note 2(E) for additional information on the effects of the accounting change.
Percent columns indicate:
(2) Percent of ending managed receivables as of March 1, 2010, which was $4.11 billion.
(3) Percent of total average managed receivables, principal only.
(4) Percent of ending managed receivables.
The allowance for loan losses represents an estimate of the amount of net losses inherent in the portfolio as of the
applicable reporting date and anticipated to occur during the following 12 months. The allowance is primarily based
on the credit quality of the underlying receivables, historical loss trends and forecasted forward loss curves. We also
take into account recent trends in delinquencies and losses, recovery rates and the underlying economic
environment. The provision for loan losses is the periodic cost of maintaining an adequate allowance.
The decrease in the allowance from $58.6 million, or 1.4% of ending managed receivables, as of March 1, 2010, to
$38.9 million, or 0.9% of ending managed receivables, as of February 28, 2011, reflected favorable trends in net
charge-offs, the record high recovery rate relative to historical norms and the credit profile of new loan originations,
which benefited from CAF’s tightening of lending standards beginning in fiscal 2010. In the first quarter of fiscal
2011, net charge-offs were significantly lower than our original projections. As a result, we reduced our estimate of
future loan losses on our existing portfolio of managed receivables. The favorability in net charge-offs and the