CarMax 2011 Annual Report Download - page 54
Download and view the complete annual report
Please find page 54 of the 2011 CarMax annual report below. You can navigate through the pages in the report by either clicking on the pages listed below, or by using the keyword search tool below to find specific information within the annual report.-
 1
1 -
2
-
3
-
4
-
5
-
6
-
7
-
8
-
9
-
10
-
11
-
12
-
13
-
14
-
15
-
16
-
17
-
18
-
19
-
20
-
21
-
22
-
23
-
24
-
25
-
26
-
27
-
28
-
29
-
30
-
31
-
32
-
33
-
34
-
35
-
36
-
37
-
38
-
39
-
40
-
41
-
42
-
43
-
 44
44 -
 45
45 -
 46
46 -
 47
47 -
 48
48 -
 49
49 -
 50
50 -
 51
51 -
 52
52 -
 53
53 -
 54
54 -
 55
55 -
 56
56 -
 57
57 -
 58
58 -
 59
59 -
 60
60 -
 61
61 -
 62
62 -
 63
63 -
 64
64 -
65
-
66
-
67
-
68
-
69
-
70
-
71
-
72
-
73
-
74
-
75
-
76
-
77
-
78
-
79
-
80
-
81
-
82
-
83
-
84
-
85
-
86
-
87
-
88
-
89
-
90
-
91
-
92
-
93
-
94
-
95
-
96
-
97
-
98
-
99
-
100
 |
 |

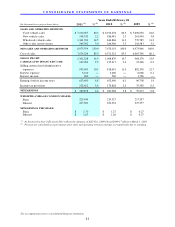
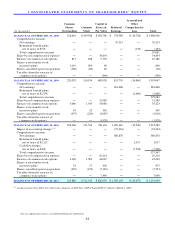
C O N S O L I D A T E D S T A T E M E N T S O F S H A R E H O L D E R S ’ E Q U I T Y
See accompanying notes to consolidated financial statements.
44
(In thousands)
BALANCE AS OF FEBRUARY 29, 2008 218,616 109,308$ 641,766$ 754,580$ (16,728)$ 1,488,926$
Comprehensive income:
Net earnings ― ― ― 59,213 ― 59,213
Retirement benefit plans,
net of taxes of $176 ― ― ― ― (132) (132)
Total comprehensive income 59,081
Share-based compensation expense ― ― 34,854 ― ― 34,854
Exercise of common stock options 817 408 9,778 ― ― 10,186
Shares issued under stock
incentive plans 1,119 560 40 ― ― 600
Shares cancelled upon reacquisition
(160) (80) 40 ― ― (40)
Tax effect from the exercise of
common stock options ― ― (540) ― ― (540)
BALANCE AS OF FEBRUARY 28, 2009 220,392 110,196 685,938 813,793 (16,860) 1,593,067
Comprehensive income:
Net earnings ― ― ― 281,668 ― 281,668
Retirement benefit plans,
net of taxes of $1,556 ― ― ― ― (2,686) (2,686)
Total comprehensive income 278,982
Share-based compensation expense ― ― 31,589 ― ― 31,589
Exercise of common stock options 3,086 1,543 33,680 ― ― 35,223
Shares issued under stock
incentive plans 45 23 542 ― ― 565
Shares cancelled upon reacquisition
(457) (229) (3,687) ― ― (3,916)
Tax effect from the exercise of
common stock options ― ― (1,928) ― ― (1,928)
BALANCE AS OF FEBRUARY 28, 2010 223,066 111,533 746,134 1,095,461 (19,546) 1,933,582
Impact of accounting change (1) ― ― ― (93,234) ― (93,234)
Comprehensive income:
Net earnings ― ― ― 380,878 ― 380,878
Retirement benefit plans,
net of taxes of $1,215 ― ― ― ― 2,017 2,017
Cash flow hedges,
net of taxes of $398 ― ― ― ― (7,528) (7,528)
Total comprehensive income 375,367
Share-based compensation expense ― ― 29,214 ― ― 29,214
Exercise of common stock options 3,126 1,563 44,067 ― ― 45,630
Shares issued under stock
incentive plans 33 17 458 ― ― 475
Shares cancelled upon reacquisition
(339) (170) (7,183) ― ― (7,353)
Tax effect from the exercise of
common stock options ― ― 7,949 ― ― 7,949
BALANCE AS OF FEBRUARY 28, 2011 225,886 112,943$ 820,639$ 1,383,105$ (25,057)$ 2,291,630$
Total
Accumulated
Common
Capital in
Other
Shares
Common
Excess of
Retained
Comprehensive
Outstanding
Stock
Par Value
Earnings
Loss
(1) As discussed in Note 2(E), this reflects the adoption of ASU Nos. 2009-16 and 2009-17 effective March 1, 2010