CarMax 2011 Annual Report Download - page 44
Download and view the complete annual report
Please find page 44 of the 2011 CarMax annual report below. You can navigate through the pages in the report by either clicking on the pages listed below, or by using the keyword search tool below to find specific information within the annual report.-
 1
1 -
2
-
3
-
4
-
5
-
6
-
7
-
8
-
9
-
10
-
11
-
12
-
13
-
14
-
15
-
16
-
17
-
18
-
19
-
20
-
21
-
22
-
23
-
24
-
25
-
26
-
27
-
28
-
29
-
30
-
31
-
32
-
33
-
 34
34 -
 35
35 -
 36
36 -
 37
37 -
 38
38 -
 39
39 -
 40
40 -
 41
41 -
 42
42 -
 43
43 -
 44
44 -
 45
45 -
 46
46 -
 47
47 -
 48
48 -
 49
49 -
 50
50 -
 51
51 -
 52
52 -
 53
53 -
 54
54 -
55
-
56
-
57
-
58
-
59
-
60
-
61
-
62
-
63
-
64
-
65
-
66
-
67
-
68
-
69
-
70
-
71
-
72
-
73
-
74
-
75
-
76
-
77
-
78
-
79
-
80
-
81
-
82
-
83
-
84
-
85
-
86
-
87
-
88
-
89
-
90
-
91
-
92
-
93
-
94
-
95
-
96
-
97
-
98
-
99
-
100
 |
 |
34
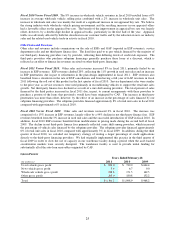
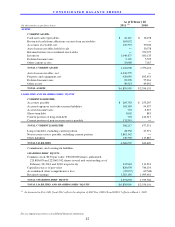
Inventory totaled $1.05 billion as of the end of fiscal 2011, $843.1 million as of the end of fiscal 2010 and $703.2
million as of the end of fiscal 2009. The 24% increase in inventory during fiscal 2011 was attributable to the
combination of an 18% increase in used vehicle units in inventory and the rise in vehicle acquisition costs resulting
from changes in wholesale vehicle valuations. The increase in units reflected the additional vehicles required to
support recent sales trends, as well as the effect of the three stores opened during fiscal 2011. The 20% increase in
inventory during fiscal 2010 was attributable to the increase in our vehicle acquisition costs caused by appreciation
in wholesale vehicle values, combined with a 10% increase in used vehicle units in inventory. The increase in units
reflected the additional vehicles required to support sales trends in the fourth quarter of fiscal 2010. The increases in
used vehicle units in inventory in fiscal 2010 and 2011 also reflected a gradual return to more normalized levels of
saleable inventory per store, following dramatic reductions made in fiscal 2009 in response to falling customer
demand and sales levels during that year.
We utilize derivative instruments to manage exposures that arise from business activities that result in the receipt or
payment of future known and uncertain cash amounts, the values of which are determined by interest rates. Prior to
March 1, 2010, no derivative instruments were designated as accounting hedges, as we believed this treatment was
best aligned with our use of gain-on-sale accounting. In conjunction with the adoption of the new accounting for
securitized receivables as of the beginning of fiscal 2011, we have begun to designate certain derivative instruments
as cash flow hedges of interest rate risk, as we believe this treatment is better aligned with our current accounting
policies.
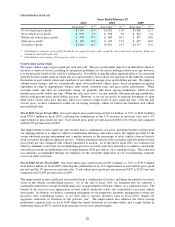
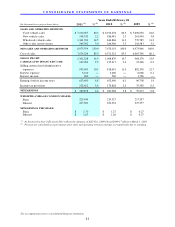
Investing Activities. Net cash used in investing activities was $72.2 million in fiscal 2011, $21.3 million in fiscal
2010 and $155.3 million in fiscal 2009. Investing activities primarily consist of capital expenditures, which totaled
$76.6 million in fiscal 2011, $22.4 million in fiscal 2010 and $185.7 million in fiscal 2009. During this three-year
period, annual capital spending was lower than in the immediately preceding years, reflecting our decision in
December 2008 to temporarily suspend store growth. In fiscal 2011, capital spending primarily included
construction costs related to stores planned to be opened in fiscal 2012 and real estate acquisitions for future store
openings. No material construction costs were incurred in fiscal 2011 related to the three stores opened that year, as
these stores were built in fiscal 2009, but we chose not to open them until economic conditions improved. In fiscal
2010, capital spending primarily represented expenditures required to maintain our existing structures that were
capital in nature, which were fairly modest because of the relatively young average age of our store base. During
fiscal 2009, we opened 11 used car superstores and we completed construction of 3 additional stores that were
subsequently opened in fiscal 2011.
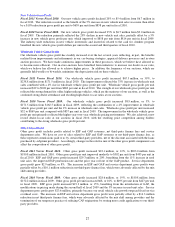
Historically, capital expenditures have been funded with internally-generated funds, debt and sale-leaseback
transactions. Net proceeds from the sale of assets totaled $0.7 million in fiscal 2010 and $34.3 million in fiscal
2009. During fiscal 2009, we completed sale-leaseback transactions for our two used car superstores in Austin,
Texas.
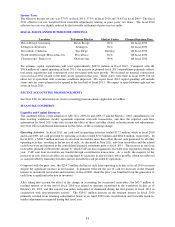
As of February 28, 2011, we owned 46 of our 103 used car superstores and our home office in Richmond, Virginia.
In addition, five existing superstores and one future superstore site were accounted for as capital leases.
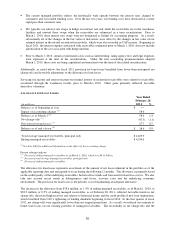
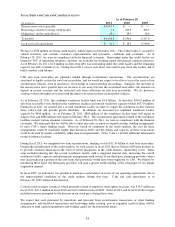
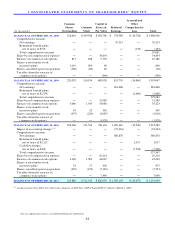
Financing Activities. During fiscal 2011, net cash provided by financing activities totaled $112.3 million, including
a $187.3 million net increase in total non-recourse notes payable, partially offset by a $122.2 million net reduction in
borrowings under the revolving credit facility and capital leases. The increase in non-recourse notes payable
resulted from the increase in securitized auto loan receivables. During fiscal 2010, net cash used in financing
activities totaled $151.3 million, including a $186.5 million reduction in borrowings under the revolving credit
facility and capital leases. During fiscal 2009, net cash provided by financing activities totaled $18.4 million,
including a $7.8 million increase in borrowings under the revolving credit facility and capital leases.
In fiscal 2011 and fiscal 2010, the reductions in borrowings under the revolving credit facility reflected the use of
excess cash to pay down debt, as well as our relatively low levels of capital spending resulting from our temporary
suspension of store growth. In fiscal 2009, total debt increased only modestly, as our significant reductions in
inventory substantially offset the effects of the decline in net earnings and our increase in cash.