CarMax 2011 Annual Report Download - page 81
Download and view the complete annual report
Please find page 81 of the 2011 CarMax annual report below. You can navigate through the pages in the report by either clicking on the pages listed below, or by using the keyword search tool below to find specific information within the annual report.-
 1
1 -
2
-
3
-
4
-
5
-
6
-
7
-
8
-
9
-
10
-
11
-
12
-
13
-
14
-
15
-
16
-
17
-
18
-
19
-
20
-
21
-
22
-
23
-
24
-
25
-
26
-
27
-
28
-
29
-
30
-
31
-
32
-
33
-
34
-
35
-
36
-
37
-
38
-
39
-
40
-
41
-
42
-
43
-
44
-
45
-
46
-
47
-
48
-
49
-
50
-
51
-
52
-
53
-
54
-
55
-
56
-
57
-
58
-
59
-
60
-
61
-
62
-
63
-
64
-
65
-
66
-
67
-
68
-
69
-
70
-
 71
71 -
 72
72 -
 73
73 -
 74
74 -
 75
75 -
 76
76 -
 77
77 -
 78
78 -
 79
79 -
 80
80 -
 81
81 -
 82
82 -
 83
83 -
 84
84 -
 85
85 -
 86
86 -
 87
87 -
 88
88 -
 89
89 -
 90
90 -
 91
91 -
92
-
93
-
94
-
95
-
96
-
97
-
98
-
99
-
100
 |
 |

71
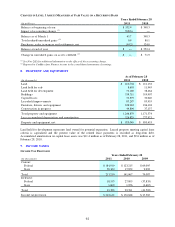
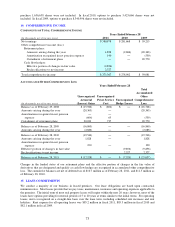
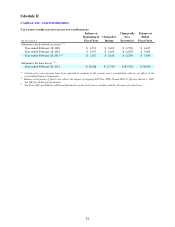
RESTRICTED STOCK ACTIVITY
(Shares in thousands)
Outstanding as of March 1, 2010 1,663 22.08$
Restricted stock granted ― ―
Restricted stock vested (743) 24.85$
Restricted stock cancelled (57) 20.30$
Outstanding as of February 28, 2011 863 19.81$
Number of
Shares
Weighted
Average
Grant Date
Fair Value
We did not grant any shares of restricted stock to our employees in fiscal 2011 or 2010. The fair value of a
restricted stock award is determined and fixed based on the fair market value of our stock on the grant date.
We realized related tax benefits of $7.7 million and $4.1 million from the vesting of restricted stock in fiscal 2011
and 2010, respectively. The realized tax benefits in fiscal 2009 were immaterial. The unrecognized compensation
costs related to nonvested restricted stock awards totaled $0.6 million as of February 28, 2011. These costs are
expected to be recognized on a straight-line basis over a weighted average period of 0.1 years.
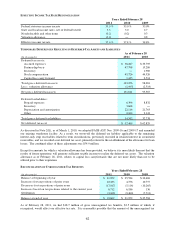
STOCK-SETTLED RESTRICTED STOCK UNIT ACTIVITY
(Units in thousands)
Outstanding as of March 1, 2010 395 16.34$
Stock units granted 278 36.28$
Stock units vested and converted (5) 19.00$
Stock units cancelled (2) 16.34$
Outstanding as of February 28, 2011 666 24.66$
Number of
Units
Weighted
Average
Grant Date
Fair Value
For the fiscal years ended February 28, 2011 and 2010, we granted MSUs of 278,445 units and 405,872 units,
respectively. The weighted average fixed fair values per share at the date of the grant for MSUs granted in fiscal
2011 and 2010 were $36.28 and $16.34, respectively. The fair values were determined using a Monte-Carlo
simulation and were based on the expected market price of our common stock on the vesting date and the expected
number of converted common shares. The unrecognized compensation costs related to nonvested MSUs totaled
$8.5 million as of February 28, 2011. These costs are expected to be recognized on a straight-line basis over a
weighted average period of 1.5 years.
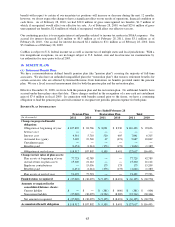
CASH-SETTLED RESTRICTED STOCK UNIT ACTIVITY
(Units in thousands)
Outstanding as of March 1, 2010 916 11.43$
Stock units granted 689 25.39$
Stock units vested and converted (14) 16.20$
Stock units cancelled (90) 16.53$
Outstanding as of February 28, 2011 1,501 17.49$
Number of
Units
Weighted
Average
Grant Date
Fair Value
During fiscal 2011 and 2010, we granted RSUs of 688,880 units and 1,005,505 units, respectively. The initial fair
market values per share for the liability-classified RSUs granted during fiscal 2011 and 2010 were $25.39 and
$11.43, respectively. The RSUs will be cash-settled upon vesting.