Berkshire Hathaway 2009 Annual Report Download - page 88
Download and view the complete annual report
Please find page 88 of the 2009 Berkshire Hathaway annual report below. You can navigate through the pages in the report by either clicking on the pages listed below, or by using the keyword search tool below to find specific information within the annual report.-
 1
1 -
2
-
3
-
4
-
5
-
6
-
7
-
8
-
9
-
10
-
11
-
12
-
13
-
14
-
15
-
16
-
17
-
18
-
19
-
20
-
21
-
22
-
23
-
24
-
25
-
26
-
27
-
28
-
29
-
30
-
31
-
32
-
33
-
34
-
35
-
36
-
37
-
38
-
39
-
40
-
41
-
42
-
43
-
44
-
45
-
46
-
47
-
48
-
49
-
50
-
51
-
52
-
53
-
54
-
55
-
56
-
57
-
58
-
59
-
60
-
61
-
62
-
63
-
64
-
65
-
66
-
67
-
68
-
69
-
70
-
71
-
72
-
73
-
74
-
75
-
76
-
77
-
 78
78 -
 79
79 -
 80
80 -
 81
81 -
 82
82 -
 83
83 -
 84
84 -
 85
85 -
 86
86 -
 87
87 -
 88
88 -
 89
89 -
 90
90 -
 91
91 -
 92
92 -
 93
93 -
 94
94 -
 95
95 -
 96
96 -
 97
97 -
 98
98 -
99
-
100
 |
 |

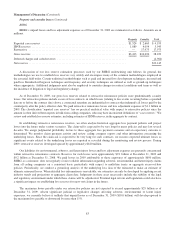
Management’s Discussion (Continued)
Market Risk Disclosures
Our Consolidated Balance Sheets include a substantial amount of assets and liabilities whose fair values are subject to
market risks. Our significant market risks are primarily associated with interest rates, equity prices, foreign currency exchange
rates and commodity prices. The fair values of our investment portfolios and equity index put option contracts remain subject to
considerable volatility, particularly over the short term. The following sections address the significant market risks associated
with our business activities.
Interest Rate Risk
We regularly invest in bonds, loans or other interest rate sensitive instruments. Our strategy is to acquire securities that are
attractively priced in relation to the perceived credit risk. Management recognizes and accepts that losses may occur with
respect to assets. We strive to maintain high credit ratings so that the cost of debt is minimized. We utilize derivative products,
such as interest rate swaps, to manage interest rate risks on a limited basis.
The fair values of our fixed maturity investments and notes payable and other borrowings will fluctuate in response to
changes in market interest rates. Increases and decreases in prevailing interest rates generally translate into decreases and
increases in fair values of those instruments. Additionally, fair values of interest rate sensitive instruments may be affected by
the creditworthiness of the issuer, prepayment options, relative values of alternative investments, the liquidity of the instrument
and other general market conditions. The fair values of fixed interest rate investments may be more sensitive to interest rate
changes than variable rate investments.
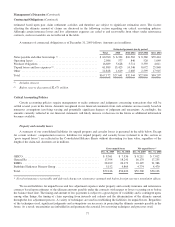
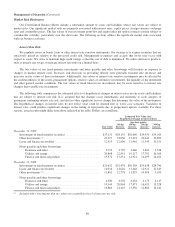
The following table summarizes the estimated effects of hypothetical changes in interest rates on our assets and liabilities
that are subject to interest rate risk. It is assumed that the changes occur immediately and uniformly to each category of
instrument containing interest rate risk, and that no other significant factors change that determine the value of the instrument.
The hypothetical changes in interest rates do not reflect what could be deemed best or worst case scenarios. Variations in
interest rates could produce significant changes in the timing of repayments due to prepayment options available. For these
reasons, actual results might differ from those reflected in the table. Dollars are in millions.
Estimated Fair Value after
Hypothetical Change in Interest Rates
(bp=basis points)
Fair Value
100 bp
decrease
100 bp
increase
200 bp
increase
300 bp
increase
December 31, 2009
Investments in fixed maturity securities ........................ $37,131 $38,155 $36,000 $34,950 $34,013
Other investments (1) ....................................... 22,197 23,056 21,391 20,620 19,892
Loans and finance receivables ............................... 12,415 12,896 11,965 11,545 11,151
Notes payable and other borrowings:
Insurance and other .................................... 3,723 3,792 3,660 3,602 3,548
Utilities and energy .................................... 20,868 22,841 19,217 17,792 16,564
Finance and financial products ........................... 15,372 15,851 14,921 14,499 14,102
December 31, 2008
Investments in fixed maturity securities ........................ $31,632 $32,478 $30,598 $29,638 $28,790
Loans and finance receivables ............................... 14,016 14,626 13,448 12,921 12,429
Other investments (1) ....................................... 11,861 12,778 11,035 10,309 9,655
Notes payable and other borrowings:
Insurance and other .................................... 4,300 4,370 4,234 4,173 4,117
Utilities and energy .................................... 19,144 20,864 17,673 16,415 15,328
Finance and financial products ........................... 13,869 14,425 13,356 12,882 12,441
(1) Includes other investments that are subject to a significant level of interest rate risk.
86