Berkshire Hathaway 2009 Annual Report Download - page 37
Download and view the complete annual report
Please find page 37 of the 2009 Berkshire Hathaway annual report below. You can navigate through the pages in the report by either clicking on the pages listed below, or by using the keyword search tool below to find specific information within the annual report.-
 1
1 -
2
-
3
-
4
-
5
-
6
-
7
-
8
-
9
-
10
-
11
-
12
-
13
-
14
-
15
-
16
-
17
-
18
-
19
-
20
-
21
-
22
-
23
-
24
-
25
-
26
-
 27
27 -
 28
28 -
 29
29 -
 30
30 -
 31
31 -
 32
32 -
 33
33 -
 34
34 -
 35
35 -
 36
36 -
 37
37 -
 38
38 -
 39
39 -
 40
40 -
 41
41 -
 42
42 -
 43
43 -
 44
44 -
 45
45 -
 46
46 -
 47
47 -
48
-
49
-
50
-
51
-
52
-
53
-
54
-
55
-
56
-
57
-
58
-
59
-
60
-
61
-
62
-
63
-
64
-
65
-
66
-
67
-
68
-
69
-
70
-
71
-
72
-
73
-
74
-
75
-
76
-
77
-
78
-
79
-
80
-
81
-
82
-
83
-
84
-
85
-
86
-
87
-
88
-
89
-
90
-
91
-
92
-
93
-
94
-
95
-
96
-
97
-
98
-
99
-
100
 |
 |

Notes to Consolidated Financial Statements (Continued)
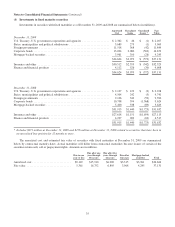
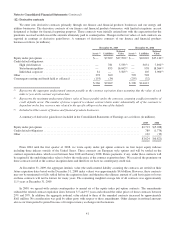
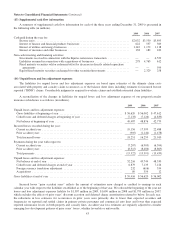
(4) Investments in fixed maturity securities
Investments in securities with fixed maturities as of December 31, 2009 and 2008 are summarized below (in millions).
Amortized
Cost
Unrealized
Gains
Unrealized
Losses *
Fair
Value
December 31, 2009
U.S. Treasury, U.S. government corporations and agencies ................... $ 2,362 $ 46 $ (1) $ 2,407
States, municipalities and political subdivisions ............................ 3,689 275 (1) 3,963
Foreign governments ................................................. 11,518 368 (42) 11,844
Corporate bonds ..................................................... 13,094 2,080 (502) 14,672
Mortgage-backed securities ............................................ 3,961 310 (26) 4,245
$34,624 $3,079 $ (572) $37,131
Insurance and other .................................................. $30,512 $2,553 $ (542) $32,523
Finance and financial products ......................................... 4,112 526 (30) 4,608
$34,624 $3,079 $ (572) $37,131
December 31, 2008
U.S. Treasury, U.S. government corporations and agencies ................... $ 2,107 $ 123 $ (2) $ 2,228
States, municipalities and political subdivisions ............................ 4,504 242 (5) 4,741
Foreign governments ................................................. 9,106 343 (59) 9,390
Corporate bonds ..................................................... 10,798 394 (1,568) 9,624
Mortgage-backed securities ............................................ 5,400 338 (89) 5,649
$31,915 $1,440 $(1,723) $31,632
Insurance and other .................................................. $27,618 $1,151 $(1,654) $27,115
Finance and financial products ......................................... 4,297 289 (69) 4,517
$31,915 $1,440 $(1,723) $31,632
* Includes $471 million at December 31, 2009 and $176 million at December 31, 2008 related to securities that have been in
an unrealized loss position for 12 months or more.
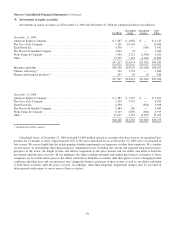
The amortized cost and estimated fair value of securities with fixed maturities at December 31, 2009 are summarized
below by contractual maturity dates. Actual maturities will differ from contractual maturities because issuers of certain of the
securities retain early call or prepayment rights. Amounts are in millions.
Due in one
year or less
Due after one
year through
five years
Due after five
years through
ten years
Due after
ten years
Mortgage-backed
securities Total
Amortized cost ........................... $5,149 $15,910 $6,289 $3,315 $3,961 $34,624
Fair value ............................... 5,361 16,752 6,805 3,968 4,245 37,131
35