Berkshire Hathaway 2009 Annual Report Download - page 38
Download and view the complete annual report
Please find page 38 of the 2009 Berkshire Hathaway annual report below. You can navigate through the pages in the report by either clicking on the pages listed below, or by using the keyword search tool below to find specific information within the annual report.-
 1
1 -
2
-
3
-
4
-
5
-
6
-
7
-
8
-
9
-
10
-
11
-
12
-
13
-
14
-
15
-
16
-
17
-
18
-
19
-
20
-
21
-
22
-
23
-
24
-
25
-
26
-
27
-
 28
28 -
 29
29 -
 30
30 -
 31
31 -
 32
32 -
 33
33 -
 34
34 -
 35
35 -
 36
36 -
 37
37 -
 38
38 -
 39
39 -
 40
40 -
 41
41 -
 42
42 -
 43
43 -
 44
44 -
 45
45 -
 46
46 -
 47
47 -
 48
48 -
49
-
50
-
51
-
52
-
53
-
54
-
55
-
56
-
57
-
58
-
59
-
60
-
61
-
62
-
63
-
64
-
65
-
66
-
67
-
68
-
69
-
70
-
71
-
72
-
73
-
74
-
75
-
76
-
77
-
78
-
79
-
80
-
81
-
82
-
83
-
84
-
85
-
86
-
87
-
88
-
89
-
90
-
91
-
92
-
93
-
94
-
95
-
96
-
97
-
98
-
99
-
100
 |
 |

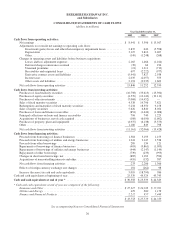
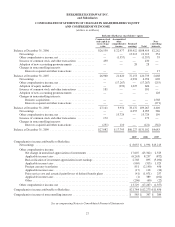
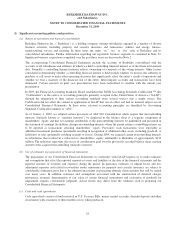
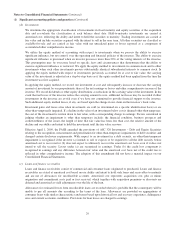
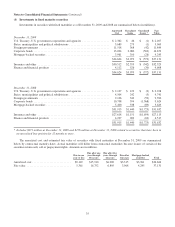
Notes to Consolidated Financial Statements (Continued)
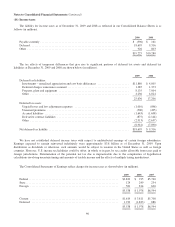
(5) Investments in equity securities
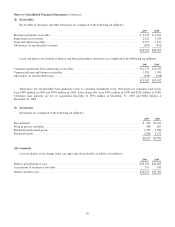
Investments in equity securities as of December 31, 2009 and December 31, 2008 are summarized below (in millions).
Cost Basis
Unrealized
Gains
Unrealized
Losses
Fair
Value
December 31, 2009
American Express Company ........................................... $ 1,287 $ 4,856 $ — $ 6,143
The Coca-Cola Company .............................................. 1,299 10,101 — 11,400
Kraft Foods Inc. ..................................................... 4,330 — (789) 3,541
The Procter & Gamble Company ........................................ 4,962 78 — 5,040
Wells Fargo & Company .............................................. 7,394 2,721 (1,094) 9,021
Other .............................................................. 17,935 7,118 (1,164) 23,889
$37,207 $24,874 $(3,047) $59,034
Insurance and other .................................................. $36,538 $23,070 $(3,046) $56,562
Utilities and energy * ................................................. 232 1,754 — 1,986
Finance and financial products * ........................................ 437 50 (1) 486
$37,207 $24,874 $(3,047) $59,034
December 31, 2008
American Express Company ........................................... $ 1,287 $ 1,525 $ — $ 2,812
The Coca-Cola Company .............................................. 1,299 7,755 — 9,054
Kraft Foods Inc. ..................................................... 4,330 — (832) 3,498
The Procter & Gamble Company ........................................ 5,484 200 — 5,684
Wells Fargo & Company .............................................. 6,703 2,850 (580) 8,973
Other .............................................................. 21,037 2,452 (4,437) 19,052
$40,140 $14,782 $(5,849) $49,073
* Included in Other assets.
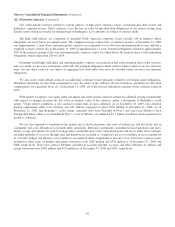
Unrealized losses at December 31, 2009 included $1,864 million related to securities that have been in an unrealized loss
position for 12 months or more. Approximately 90% of the gross unrealized losses at December 31, 2009 were concentrated in
four issuers. We use no bright-line test in determining whether impairments are temporary or other than temporary. We consider
several factors in determining other-than-temporary impairment losses including the current and expected long-term business
prospects of the issuer, the length of time and relative magnitude of the price decline and our ability and intent to hold the
investment until the price recovers. In our judgment, the future earnings potential and underlying business economics of these
companies are favorable and we possess the ability and intent to hold these securities until their prices recover. Changing market
conditions and other facts and circumstances may change the business prospects of these issuers as well as our ability and intent
to hold these securities until the prices recover. Accordingly, other-than-temporary impairment charges may be recorded in
future periods with respect to one or more of these securities.
36