Berkshire Hathaway 2009 Annual Report Download - page 54
Download and view the complete annual report
Please find page 54 of the 2009 Berkshire Hathaway annual report below. You can navigate through the pages in the report by either clicking on the pages listed below, or by using the keyword search tool below to find specific information within the annual report.-
 1
1 -
2
-
3
-
4
-
5
-
6
-
7
-
8
-
9
-
10
-
11
-
12
-
13
-
14
-
15
-
16
-
17
-
18
-
19
-
20
-
21
-
22
-
23
-
24
-
25
-
26
-
27
-
28
-
29
-
30
-
31
-
32
-
33
-
34
-
35
-
36
-
37
-
38
-
39
-
40
-
41
-
42
-
43
-
 44
44 -
 45
45 -
 46
46 -
 47
47 -
 48
48 -
 49
49 -
 50
50 -
 51
51 -
 52
52 -
 53
53 -
 54
54 -
 55
55 -
 56
56 -
 57
57 -
 58
58 -
 59
59 -
 60
60 -
 61
61 -
 62
62 -
 63
63 -
 64
64 -
65
-
66
-
67
-
68
-
69
-
70
-
71
-
72
-
73
-
74
-
75
-
76
-
77
-
78
-
79
-
80
-
81
-
82
-
83
-
84
-
85
-
86
-
87
-
88
-
89
-
90
-
91
-
92
-
93
-
94
-
95
-
96
-
97
-
98
-
99
-
100
 |
 |

Notes to Consolidated Financial Statements (Continued)
(20) Pension plans (Continued)
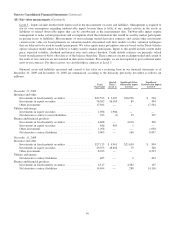
Benefit obligations under qualified U.S. defined benefit plans are funded through assets held in trusts and are not included
as assets in our Consolidated Financial Statements. Pension obligations under certain non-U.S. plans and non-qualified U.S.
plans are unfunded. As of December 31, 2009, projected benefit obligations of non-qualified U.S. plans and non-U.S. plans
which are not funded through assets held in trusts were $653 million. A reconciliation of the changes in plan assets and a
summary of plan assets held as of December 31, 2009 and 2008 is presented in the table that follows (in millions).
2009 2008 2009 2008
Plan assets at beginning of year .......... $5,322 $ 7,063 Cash and equivalents ................. $ 408 $ 535
Employer contributions ................. 224 279 Government obligations .............. 674 426
Benefits paid ......................... (408) (455) Investment funds .................... 1,470 877
Actual return on plan assets .............. 749 (1,244) Corporate obligations ................ 744 715
Business acquisitions ................... — 188 Equity securities .................... 2,152 2,213
Other and expenses .................... 39 (509) Other ............................. 478 556
Plan assets at end of year ................ $5,926 $ 5,322 $5,926 $5,322
Fair value measurements for pension assets as of December 31, 2009 follow (in millions).
Total
Fair Value
Quoted Prices
(Level 1)
Significant
Other
Observable
Inputs
(Level 2)
Significant
Unobservable
Inputs
(Level 3)
Cash and equivalents ........................................... $ 408 $ 401 $ 7 $—
Government obligations ......................................... 674 554 120 —
Investment funds ............................................... 1,470 174 1,296 —
Corporate debt obligations ....................................... 744 157 587 —
Equity securities ............................................... 2,152 2,131 21 —
Other ........................................................ 478 27 223 228
$5,926 $3,444 $2,254 $228
Refer to Note 18 for a discussion of the three levels in the hierarchy of fair values. Pension assets measured at fair value
with significant unobservable inputs (Level 3) for the year ended December 31, 2009 consisted primarily of real estate and
limited partnership interests.
Pension plan assets are generally invested with the long-term objective of earning sufficient amounts to cover expected
benefit obligations, while assuming a prudent level of risk. There are no target investment allocation percentages with respect to
individual or categories of investments. Allocations may change as a result of changing market conditions and investment
opportunities. The expected rates of return on plan assets reflect subjective assessments of expected invested asset returns over a
period of several years. Generally, past investment returns are not given significant consideration when establishing
assumptions for expected long-term rates of returns on plan assets. Actual experience will differ from the assumed rates.
The defined benefit plans expect to pay benefits to participants over the next ten years, reflecting expected future service as
appropriate, as follows (in millions): 2010 – $418; 2011 – $429; 2012 – $449; 2013 – $469; 2014 – $484; and 2015 to 2019 –
$2,599. Sponsoring subsidiaries expect to contribute $284 million to defined benefit pension plans in 2010.
52