Berkshire Hathaway 2009 Annual Report Download - page 60
Download and view the complete annual report
Please find page 60 of the 2009 Berkshire Hathaway annual report below. You can navigate through the pages in the report by either clicking on the pages listed below, or by using the keyword search tool below to find specific information within the annual report.-
 1
1 -
2
-
3
-
4
-
5
-
6
-
7
-
8
-
9
-
10
-
11
-
12
-
13
-
14
-
15
-
16
-
17
-
18
-
19
-
20
-
21
-
22
-
23
-
24
-
25
-
26
-
27
-
28
-
29
-
30
-
31
-
32
-
33
-
34
-
35
-
36
-
37
-
38
-
39
-
40
-
41
-
42
-
43
-
44
-
45
-
46
-
47
-
48
-
49
-
 50
50 -
 51
51 -
 52
52 -
 53
53 -
 54
54 -
 55
55 -
 56
56 -
 57
57 -
 58
58 -
 59
59 -
 60
60 -
 61
61 -
 62
62 -
 63
63 -
 64
64 -
 65
65 -
 66
66 -
 67
67 -
 68
68 -
 69
69 -
 70
70 -
71
-
72
-
73
-
74
-
75
-
76
-
77
-
78
-
79
-
80
-
81
-
82
-
83
-
84
-
85
-
86
-
87
-
88
-
89
-
90
-
91
-
92
-
93
-
94
-
95
-
96
-
97
-
98
-
99
-
100
 |
 |

Notes to Consolidated Financial Statements (Continued)
(22) Business segment data (Continued)
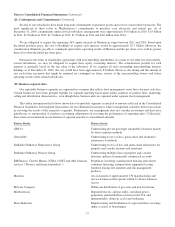
Other businesses not specifically identified with reportable business segments consist of a large, diverse group of
manufacturing, service and retailing businesses.
Business Identity Business Activity
Manufacturing Acme Building Brands, Benjamin Moore, H.H. Brown Shoe
Group, CTB, Fechheimer Brothers, Forest River, Fruit of the
Loom, Garan, IMC, Johns Manville, Justin Brands, Larson-
Juhl, MiTek, Richline and Scott Fetzer
Service Buffalo News, Business Wire, FlightSafety, International
Dairy Queen, Pampered Chef, NetJets and TTI
Retailing Ben Bridge Jeweler, Borsheims, Helzberg Diamond Shops,
Jordan’s Furniture, Nebraska Furniture Mart, See’s Candies,
Star Furniture and R.C. Willey
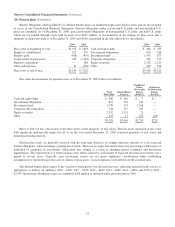
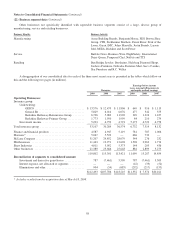
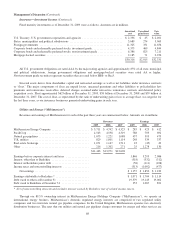
A disaggregation of our consolidated data for each of the three most recent years is presented in the tables which follow on
this and the following two pages (in millions).
Revenues
Earnings before income
taxes, noncontrolling interests
and equity method earnings
2009 2008 2007 2009 2008 2007
Operating Businesses:
Insurance group:
Underwriting:
GEICO ................................... $ 13,576 $ 12,479 $ 11,806 $ 649 $ 916 $ 1,113
General Re ................................ 5,829 6,014 6,076 477 342 555
Berkshire Hathaway Reinsurance Group ........ 6,706 5,082 11,902 349 1,324 1,427
Berkshire Hathaway Primary Group ............ 1,773 1,950 1,999 84 210 279
Investment income ............................. 5,223 4,759 4,791 5,173 4,722 4,758
Total insurance group ............................... 33,107 30,284 36,574 6,732 7,514 8,132
Finance and financial products ........................ 4,587 4,947 5,119 781 787 1,006
Marmon * ........................................ 5,067 5,529 — 686 733 —
McLane Company .................................. 31,207 29,852 28,079 344 276 232
MidAmerican ..................................... 11,443 13,971 12,628 1,528 2,963 1,774
Shaw Industries .................................... 4,011 5,052 5,373 144 205 436
Other businesses ................................... 21,380 25,666 25,648 884 2,809 3,279
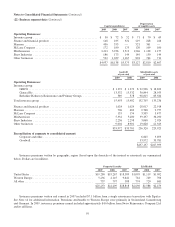
110,802 115,301 113,421 11,099 15,287 14,859
Reconciliation of segments to consolidated amount:
Investment and derivative gains/losses .............. 787 (7,461) 5,509 787 (7,461) 5,509
Interest expense, not allocated to segments .......... — — — (42) (35) (52)
Eliminations and other .......................... 904 (54) (685) (292) (217) (155)
$112,493 $107,786 $118,245 $11,552 $ 7,574 $20,161
* Includes results from the acquisition date of March 18, 2008.
58