Berkshire Hathaway 2009 Annual Report Download - page 75
Download and view the complete annual report
Please find page 75 of the 2009 Berkshire Hathaway annual report below. You can navigate through the pages in the report by either clicking on the pages listed below, or by using the keyword search tool below to find specific information within the annual report.-
 1
1 -
2
-
3
-
4
-
5
-
6
-
7
-
8
-
9
-
10
-
11
-
12
-
13
-
14
-
15
-
16
-
17
-
18
-
19
-
20
-
21
-
22
-
23
-
24
-
25
-
26
-
27
-
28
-
29
-
30
-
31
-
32
-
33
-
34
-
35
-
36
-
37
-
38
-
39
-
40
-
41
-
42
-
43
-
44
-
45
-
46
-
47
-
48
-
49
-
50
-
51
-
52
-
53
-
54
-
55
-
56
-
57
-
58
-
59
-
60
-
61
-
62
-
63
-
64
-
 65
65 -
 66
66 -
 67
67 -
 68
68 -
 69
69 -
 70
70 -
 71
71 -
 72
72 -
 73
73 -
 74
74 -
 75
75 -
 76
76 -
 77
77 -
 78
78 -
 79
79 -
 80
80 -
 81
81 -
 82
82 -
 83
83 -
 84
84 -
 85
85 -
86
-
87
-
88
-
89
-
90
-
91
-
92
-
93
-
94
-
95
-
96
-
97
-
98
-
99
-
100
 |
 |

Management’s Discussion (Continued)
Manufacturing, Service and Retailing (Continued)
Retailing (Continued)
Retailing revenues were $3,104 million in 2008, a decrease of $293 million (9%) versus 2007. Pre-tax earnings of $163
million in 2008 declined $111 million (41%) compared to 2007. Seven of the eight retail operations experienced revenue
declines and all eight of these operations had declines in earnings compared to 2007.
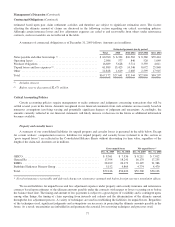
Finance and Financial Products
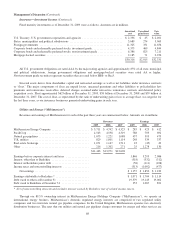
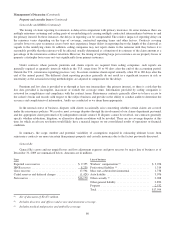
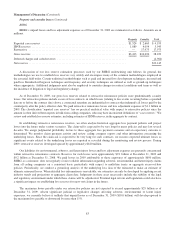
A summary of revenues and earnings from our finance and financial products businesses follows. Amounts are in millions.
Revenues Earnings
2009 2008 2007 2009 2008 2007
Manufactured housing and finance ................................. $3,257 $3,560 $3,665 $187 $206 $ 526
Furniture/transportation equipment leasing .......................... 661 773 810 14 87 111
Other ........................................................ 669 614 644 580 494 369
$4,587 $4,947 $5,119
Pre-tax earnings ................................................ 781 787 1,006
Income taxes and noncontrolling interests ........................... 287 308 374
$494 $479 $ 632
Revenues in 2009 of our manufactured housing and finance business (Clayton Homes) declined $303 million (9%) from
2008. The decrease was primarily due to a 16% decline in units sold partially offset by higher average selling prices as a result
of product mix changes and a slight increase in installment loan interest and other investment income. Revenues in 2008
declined $105 million (3%) from 2007, reflecting lower revenues from home sales and was partially offset by higher installment
loan interest income. Also, revenues in 2007 included approximately $90 million from the housing communities division which
was sold in the first quarter of 2008. Installment loan balances were approximately $12.3 billion as of December 31, 2009, a
decline of about $300 million from December 31, 2008.
Pre-tax earnings of Clayton Homes were $187 million in 2009, a decline of $19 million (9%) from 2008. Pre-tax earnings
in 2009 were negatively impacted by a $79 million increase in estimated loan loss provisions partially offset by improved
margins from manufactured home sales and lower selling, general and administrative expenses arising from cost reduction
efforts. Pre-tax earnings in 2008 declined $320 million (61%) from 2007. Earnings in 2008 included a $125 million increase in
estimated loan loss provisions, $25 million of losses arising from Hurricanes Gustav and Ike and $38 million in losses from
asset writedowns and plant closure costs. In both years overall operating results were negatively impacted by declines in home
sales, increased borrowing costs and higher levels of borrowings.
Revenues and pre-tax earnings from our furniture/transportation equipment leasing businesses in 2009 declined
$112 million (14%) and $73 million (84%), respectively, compared to 2008. The declines primarily reflected lower rental
income driven by relatively low utilization rates for over-the-road trailer and storage units, and lower furniture rentals.
Significant cost components of this business are fixed (depreciation and facility expenses), so earnings declined
disproportionately to revenues. Revenues and pre-tax earnings for 2008 decreased $37 million (5%) and $24 million (22%),
respectively, as compared to 2007, primarily for the reasons previously stated.
Revenues and earnings of Clayton Homes and the furniture/transportation equipment leasing businesses have been
negatively affected by the economic recession as well as the credit crisis. Our manufactured housing loan programs are
currently at a competitive disadvantage to the traditional single family mortgage market, which is currently receiving favorable
interest rate subsidies from the U.S. government through government agency insured mortgages. Unlike site-built homes, very
few factory-built homes qualify for these mortgages. This has produced a negative impact on manufactured housing
construction and sales. However, even under these conditions, we believe Clayton Homes will continue to operate profitably.
Earnings from our other finance business activities include investment income earned from a portfolio of fixed maturity
and equity investments held by certain finance subsidiaries; interest earned from a small portfolio of long-held commercial real
estate loans; net interest earned from an annuity insurance business, whose earnings primarily consist of the net interest accruing
on interest bearing assets and liabilities; and earnings from an interest rate spread over the cost of Berkshire Hathaway Finance
Corporation borrowing costs charged to and reflected in Clayton Homes’ earnings.
73