Berkshire Hathaway 2009 Annual Report Download - page 73
Download and view the complete annual report
Please find page 73 of the 2009 Berkshire Hathaway annual report below. You can navigate through the pages in the report by either clicking on the pages listed below, or by using the keyword search tool below to find specific information within the annual report.-
 1
1 -
2
-
3
-
4
-
5
-
6
-
7
-
8
-
9
-
10
-
11
-
12
-
13
-
14
-
15
-
16
-
17
-
18
-
19
-
20
-
21
-
22
-
23
-
24
-
25
-
26
-
27
-
28
-
29
-
30
-
31
-
32
-
33
-
34
-
35
-
36
-
37
-
38
-
39
-
40
-
41
-
42
-
43
-
44
-
45
-
46
-
47
-
48
-
49
-
50
-
51
-
52
-
53
-
54
-
55
-
56
-
57
-
58
-
59
-
60
-
61
-
62
-
 63
63 -
 64
64 -
 65
65 -
 66
66 -
 67
67 -
 68
68 -
 69
69 -
 70
70 -
 71
71 -
 72
72 -
 73
73 -
 74
74 -
 75
75 -
 76
76 -
 77
77 -
 78
78 -
 79
79 -
 80
80 -
 81
81 -
 82
82 -
 83
83 -
84
-
85
-
86
-
87
-
88
-
89
-
90
-
91
-
92
-
93
-
94
-
95
-
96
-
97
-
98
-
99
-
100
 |
 |
Management’s Discussion (Continued)
Manufacturing, Service and Retailing (Continued)
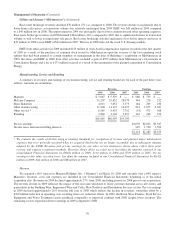
McLane Company
McLane Company, Inc., (“McLane”) is a wholesale distributor of grocery and non-food products to retailers, convenience
stores and restaurants. McLane’s business is marked by high sales volume and very low profit margins. Revenues were $31,207
million in 2009, an increase of $1,355 million (5%) compared to 2008. The increase in revenues in 2009 reflected an 8%
increase in the grocery business, partially offset by an 11% decline from the foodservice business. The revenue increases in
2009 reflected additional grocery customers as well as manufacturer price increases and state excise tax increases.
Approximately one-third of McLane’s annual revenues are from Wal-Mart. A curtailment of purchasing by Wal-Mart could
have a material adverse impact on McLane’s earnings.
Pre-tax earnings in 2009 increased $68 million (25%) over 2008. Earnings in 2009 included the impact of a substantial
inventory price change gain associated with an increase in federal excise tax on cigarettes. Many tobacco manufacturers raised
prices in anticipation of the tax increase, which allowed McLane to generate a one-time price change gain. The increase in
earnings from the inventory price change gain was partially offset by a federally mandated one-time floor stock tax on related
inventory held and by lower earnings from the foodservice business. The gross margin rate in 2009 was 5.72%. Cigarette excise
tax inflation has a negative impact on margins by inflating gross sales while providing only marginal increases in profit since
most markups are on a fixed amount per unit as opposed to a percentage of gross sales. Operating results in 2009 also benefited
from lower fuel costs and operating expense control efforts.
In 2008, revenues increased $1,773 million (6%) compared to 2007, reflecting increased customers and manufacturer price
increases and state excise tax increases. Pre-tax earnings in 2008 increased $44 million (19%) over 2007. The increase in
earnings in 2008 was primarily attributable to the increase in sales and to a lesser degree a slight increase in gross margins. The
gross margin rate was 5.91% in 2008 compared to 5.79% in 2007. The comparative increase in the gross margin rate reflected
price changes related to certain categories of grocery products and the impact of a heavy liquids sales surcharge.
Shaw Industries
Shaw Industries (“Shaw”) is the world’s largest manufacturer of tufted broadloom carpets and is a full-service flooring
company. Shaw’s sales volume and earnings during the last two years have been negatively impacted by the depressed
residential housing market and the economic recession in the U.S.
Revenues in 2009 were $4,011 million, a decline of $1,041 million (21%) from 2008. The revenue decrease in 2009 was
primarily due to an 18% reduction in year-to-date carpet sales volume. In 2009, pre-tax earnings declined $61 million
(30%) from 2008. Our operating results in 2009 benefitted from lower raw material costs. However, the favorable impact of the
lower material costs was more than offset by relatively higher manufacturing costs attributable to significant declines in sales
volume, which decreased plant operating levels and manufacturing efficiencies and resulted in lower selling and general
expense coverage. During 2009, Shaw incurred costs of $101 million related to plant closures compared to $59 million in 2008.
Revenues in 2008 declined $321 million (6%) compared to 2007, principally due to a reduction in year-to-date carpet sales
volume, partially offset by higher average selling prices and revenues from business acquisitions. In 2008, pre-tax earnings
declined $231 million (53%) to $205 million. The decline was attributable to both lower sales volume and higher product costs.
Increases in petrochemical based raw material costs along with reduced manufacturing efficiencies caused the product cost
increase. Pre-tax earnings in 2008 also included the aforementioned $59 million of charges related to plant closures.
Other manufacturing
Our other manufacturing businesses include a wide array of businesses. Included in this group are several manufacturers of
building products (Acme Building Brands, Benjamin Moore, Johns Manville and MiTek) and apparel (led by Fruit of the Loom
which includes the Russell athletic apparel and sporting goods business and the Vanity Fair Brands women’s intimate apparel
business). Also included in this group are Forest River, a leading manufacturer of leisure vehicles, CTB International (“CTB”),
a manufacturer of equipment for the livestock and agricultural industries and ISCAR Metalworking Companies (“IMC”), an
industry leader in the metal cutting tools business with operations worldwide.
71