Berkshire Hathaway 2009 Annual Report Download - page 81
Download and view the complete annual report
Please find page 81 of the 2009 Berkshire Hathaway annual report below. You can navigate through the pages in the report by either clicking on the pages listed below, or by using the keyword search tool below to find specific information within the annual report.-
 1
1 -
2
-
3
-
4
-
5
-
6
-
7
-
8
-
9
-
10
-
11
-
12
-
13
-
14
-
15
-
16
-
17
-
18
-
19
-
20
-
21
-
22
-
23
-
24
-
25
-
26
-
27
-
28
-
29
-
30
-
31
-
32
-
33
-
34
-
35
-
36
-
37
-
38
-
39
-
40
-
41
-
42
-
43
-
44
-
45
-
46
-
47
-
48
-
49
-
50
-
51
-
52
-
53
-
54
-
55
-
56
-
57
-
58
-
59
-
60
-
61
-
62
-
63
-
64
-
65
-
66
-
67
-
68
-
69
-
70
-
 71
71 -
 72
72 -
 73
73 -
 74
74 -
 75
75 -
 76
76 -
 77
77 -
 78
78 -
 79
79 -
 80
80 -
 81
81 -
 82
82 -
 83
83 -
 84
84 -
 85
85 -
 86
86 -
 87
87 -
 88
88 -
 89
89 -
 90
90 -
 91
91 -
92
-
93
-
94
-
95
-
96
-
97
-
98
-
99
-
100
 |
 |
Management’s Discussion (Continued)
Property and casualty losses (Continued)
GEICO (Continued)
age-to-age projections of the ultimate counts by accident quarter. Reported claims are subtracted from the ultimate claim
projections to produce an estimate of the number of unreported claims. The number of unreported claims is multiplied by an
estimate of the average cost per unreported claim to produce the IBNR reserve amount. Actuarial techniques are difficult to
apply reliably in certain situations, such as to new legal precedents, class action suits or recent catastrophes. Consequently,
supplemental IBNR reserves for these types of events may be established through the collaborative effort of actuarial, claims
and other management.
For each of GEICO’s major coverages, we test the adequacy of the total loss reserves using one or more actuarial
projections based on claim closure models, paid loss triangles and incurred loss triangles. Each type of projection analyzes loss
occurrence data for claims occurring in a given period and projects the ultimate cost.
Loss reserve estimates recorded at the end of 2008 developed downward by $194 million when reevaluated through
December 31, 2009, producing a corresponding increase to pre-tax earnings in 2009. These downward reserve developments
represented approximately 1% of earned premiums in 2009 and approximately 2.6% of the prior year-end reserve amount.
Reserving assumptions at December 31, 2009 were modified appropriately to reflect the most recent frequency and severity
results. Future reserve development will depend on whether actual frequency and severity are more or less than anticipated.
Within the automobile line of business, reserves for liability coverages are more uncertain due to the longer claim-tails.
Approximately 90% of GEICO’s reserves as of December 31, 2009 were for automobile liability, of which bodily injury (“BI”)
coverage accounted for approximately 55%. We believe it is reasonably possible that the average BI severity will change by at
least one percentage point from the severity used. If actual BI severity changes one percentage point from what was used in
establishing the reserves, our reserves would develop up or down by approximately $124 million resulting in a corresponding
decrease or increase in pre-tax earnings. Many of the same economic forces that would likely cause BI severity to be different
from expected would likely also cause severities for other injury coverages to differ in the same direction.
Our exposure in GEICO to highly uncertain losses is believed to be limited to certain commercial excess umbrella policies
written during a period from 1981 to 1984. Remaining reserves associated with such exposure are currently a relatively
insignificant component of GEICO’s total reserves (approximately 2%) and there is minimal apparent asbestos or environmental
liability exposure. Related claim activity over the past year was insignificant.
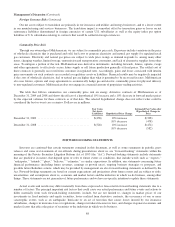
General Re and BHRG
Property and casualty loss reserves of our General Re and BHRG underwriting units derive primarily from assumed
reinsurance. Additional uncertainties are unique to loss reserving processes for reinsurance. The nature, extent, timing and
perceived reliability of information received from ceding companies varies widely depending on the type of coverage, the
contractual reporting terms (which are affected by market conditions and practices) and other factors. Due to the lack of
standardization of contract terms and conditions, the wide variability of coverage needs of individual clients and the tendency
for those needs to change rapidly in response to market conditions, the ongoing economic impact of such uncertainties, in and of
themselves, cannot be reliably measured.
The nature and extent of loss information provided under many facultative, per occurrence excess contracts or retroactive
contracts may not differ significantly from the information received under a primary insurance contract. This occurs when
company personnel either work closely with the ceding company in settling individual claims or manage the claims themselves.
Loss information from aggregate excess-of-loss contracts, including catastrophe losses and quota-share treaties, is often less
detailed. Occasionally, loss information is reported in summary format rather than on an individual claim basis. Loss data is
provided through periodic reports and may include the amount of ceded losses paid where reimbursement is sought as well as
case loss reserve estimates. Ceding companies infrequently provide IBNR estimates to reinsurers.
Each of our reinsurance businesses has established practices to identify and gather needed information from clients. These
practices include, for example, comparison of expected premiums to reported premiums to help identify delinquent client
periodic reports and claim reviews to facilitate loss reporting and identify inaccurate or incomplete claim reporting. These
practices are periodically evaluated and changed as conditions, risk factors and unanticipated areas of exposures are identified.
79