Berkshire Hathaway 2009 Annual Report Download - page 76
Download and view the complete annual report
Please find page 76 of the 2009 Berkshire Hathaway annual report below. You can navigate through the pages in the report by either clicking on the pages listed below, or by using the keyword search tool below to find specific information within the annual report.-
 1
1 -
2
-
3
-
4
-
5
-
6
-
7
-
8
-
9
-
10
-
11
-
12
-
13
-
14
-
15
-
16
-
17
-
18
-
19
-
20
-
21
-
22
-
23
-
24
-
25
-
26
-
27
-
28
-
29
-
30
-
31
-
32
-
33
-
34
-
35
-
36
-
37
-
38
-
39
-
40
-
41
-
42
-
43
-
44
-
45
-
46
-
47
-
48
-
49
-
50
-
51
-
52
-
53
-
54
-
55
-
56
-
57
-
58
-
59
-
60
-
61
-
62
-
63
-
64
-
65
-
 66
66 -
 67
67 -
 68
68 -
 69
69 -
 70
70 -
 71
71 -
 72
72 -
 73
73 -
 74
74 -
 75
75 -
 76
76 -
 77
77 -
 78
78 -
 79
79 -
 80
80 -
 81
81 -
 82
82 -
 83
83 -
 84
84 -
 85
85 -
 86
86 -
87
-
88
-
89
-
90
-
91
-
92
-
93
-
94
-
95
-
96
-
97
-
98
-
99
-
100
 |
 |

Management’s Discussion (Continued)
Finance and Financial Products (Continued)
Revenues and pre-tax earnings of other finance business activities in 2009 increased $55 million (9%) and $86 million
(17%), respectively, due primarily to increased investment income earned from our acquisitions of higher yielding fixed
maturity and equity investments, including portions of our acquisitions of Goldman Sachs and Wrigley securities.
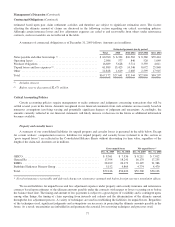
Investment and Derivative Gains/Losses
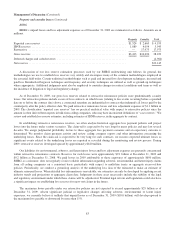
A summary of investment and derivative gains and losses and other-than-temporary impairment losses on investments
follows. Amounts are in millions.
2009 2008 2007
Investment gains/losses from –
Sales and other disposals of investments –
Insurance and other ....................................................... $ 277 $ 912 $5,308
Finance and financial products .............................................. 110 6 187
Other-than-temporary impairment losses on investments .............................. (3,155) (1,813) —
Other ...................................................................... (69) 255 103
(2,837) (640) 5,598
Derivative gains/losses from –
Credit default contracts ........................................................ 789 (1,774) 127
Equity index put option contracts ................................................ 2,713 (5,028) (283)
Other derivative contracts ...................................................... 122 (19) 67
3,624 (6,821) (89)
Gains/losses before income taxes and noncontrolling interests ............................. 787 (7,461) 5,509
Income taxes and noncontrolling interests ..................................... 301 (2,816) 1,930
Net gains/losses .................................................................. $ 486 $(4,645) $3,579
Investment gains or losses are recognized upon the sales of investments or as otherwise required under GAAP. The timing
of realized gains or losses from sales can have a material effect on periodic earnings. However, such gains or losses usually
have little, if any, impact on total shareholders’ equity because most equity and fixed maturity investments are carried at fair
value with any unrealized gain or loss included as components of accumulated other comprehensive income.
The recognition of an other-than-temporary impairment loss results in reductions in the cost basis of the investment, but not a
reduction in fair value. Although we have recorded other-than-temporary impairment losses in earnings, we may continue to hold
positions in most of these securities. The recognition of such losses does not necessarily indicate that sales are imminent or planned
and sales ultimately may not occur. We use no bright line tests in determining whether impairments are temporary or other than
temporary. We consider several factors in determining impairment losses including the current and expected long-term business
prospects of the issuer, the length of time and relative magnitude of the price decline and our ability and intent to hold the
investment until the price recovers.
Other-than-temporary impairment losses in 2009 predominantly relate to a first quarter charge with respect to our
investment in ConocoPhillips common stock. The market price of ConocoPhillips shares declined sharply over the last half of
2008. In 2009, we sold over half of the ConocoPhillips position we held at the end of 2008. Since a significant portion of the
decline in the market value of our investment in ConocoPhillips occurred during the last half of 2008, a significant portion of
the other-than-temporary impairment losses recorded in earnings in the first quarter of 2009 were recognized in other
comprehensive income as of December 31, 2008.
Other-than-temporary impairment losses recorded in 2008 (approximately $1.8 billion) were primarily related to investments
in twelve equity securities. The unrealized losses in these securities generally ranged from 40% to 90% of cost. After reviewing
these investments, we concluded that there was considerable uncertainty in the business prospects of these companies and thus
greater uncertainty on the recoverability of the cost of the security.
74