Berkshire Hathaway 2009 Annual Report Download - page 72
Download and view the complete annual report
Please find page 72 of the 2009 Berkshire Hathaway annual report below. You can navigate through the pages in the report by either clicking on the pages listed below, or by using the keyword search tool below to find specific information within the annual report.-
 1
1 -
2
-
3
-
4
-
5
-
6
-
7
-
8
-
9
-
10
-
11
-
12
-
13
-
14
-
15
-
16
-
17
-
18
-
19
-
20
-
21
-
22
-
23
-
24
-
25
-
26
-
27
-
28
-
29
-
30
-
31
-
32
-
33
-
34
-
35
-
36
-
37
-
38
-
39
-
40
-
41
-
42
-
43
-
44
-
45
-
46
-
47
-
48
-
49
-
50
-
51
-
52
-
53
-
54
-
55
-
56
-
57
-
58
-
59
-
60
-
61
-
 62
62 -
 63
63 -
 64
64 -
 65
65 -
 66
66 -
 67
67 -
 68
68 -
 69
69 -
 70
70 -
 71
71 -
 72
72 -
 73
73 -
 74
74 -
 75
75 -
 76
76 -
 77
77 -
 78
78 -
 79
79 -
 80
80 -
 81
81 -
 82
82 -
83
-
84
-
85
-
86
-
87
-
88
-
89
-
90
-
91
-
92
-
93
-
94
-
95
-
96
-
97
-
98
-
99
-
100
 |
 |

Management’s Discussion (Continued)
Utilities and Energy (“MidAmerican”) (Continued)
Real estate brokerage revenues declined $76 million (7%) as compared to 2008. The revenue decline was primarily due to
lower home sales prices, as transaction volume was relatively unchanged from 2008. EBIT was $43 million in 2009 compared
to a $45 million loss in 2008. The improvement in 2009 was principally due to lower commission and other operating expenses.
Real estate brokerage revenues in 2008 declined $364 million (24%) compared to 2007 due to significant declines in transaction
volume as well as lower average home sale prices. Real estate brokerage activities generated a loss before interest and taxes of
$45 million in 2008 versus EBIT of $42 million in 2007. The loss in 2008 reflected the weak U.S. housing markets.
EBIT from other activities in 2009 included $125 million in stock-based compensation expense recorded in the first quarter
of 2009 as a result of the purchase of common stock issued by MidAmerican upon the exercise of the last remaining stock
options that had been granted to certain members of management at the time of Berkshire’s acquisition of MidAmerican in
2000. Revenues and EBIT in 2008 from other activities included a gain of $917 million from MidAmerican’s investments in
Constellation Energy and a fee of $175 million received as a result of the termination of the planned acquisition of Constellation
Energy.
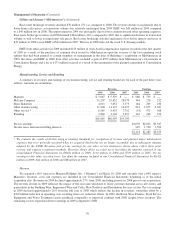
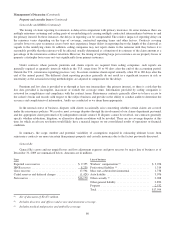
Manufacturing, Service and Retailing
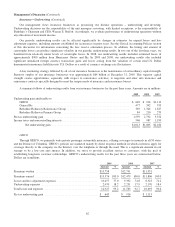
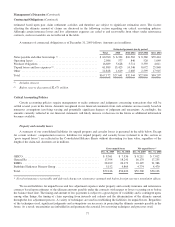
A summary of revenues and earnings of our manufacturing, service and retailing businesses for each of the past three years
follows. Amounts are in millions.
Revenues Earnings
2009 2008 2007 2009 2008 2007
Marmon ................................................ $ 5,067 $ 5,529 $ — $ 686 $ 733 $ —
McLane Company ........................................ 31,207 29,852 28,079 344 276 232
Shaw Industries .......................................... 4,011 5,052 5,373 144 205 436
Other manufacturing ...................................... 11,926 14,127 14,459 814 1,675 2,037
Other service * .......................................... 6,585 8,435 7,792 (91) 971 968
Retailing ............................................... 2,869 3,104 3,397 161 163 274
$61,665 $66,099 $59,100
Pre-tax earnings .......................................... $2,058 $4,023 $3,947
Income taxes and noncontrolling interests ..................... 945 1,740 1,594
$1,113 $2,283 $2,353
*We evaluate the results of NetJets using accounting standards for recognition of revenue and planned major maintenance
expenses that were generally accepted when we acquired NetJets but are no longer acceptable due to subsequent changes
adopted by the FASB. Revenues and pre-tax earnings for our other service businesses shown above reflect these prior
revenue and expense recognition methods. Revenues shown above exceeded (were less than) the amounts reported in our
Consolidated Financial Statements by $(942) million in 2009, $130 million in 2008 and $709 million in 2007. Pre-tax
earnings in this table exceeded (were less than) the amounts included in our Consolidated Financial Statements by $(142)
million in 2009, $(4) million in 2008 and $48 million in 2007.
Marmon
We acquired a 60% interest in Marmon Holdings, Inc. (“Marmon”) on March 18, 2008 and currently own a 64% interest.
Marmon’s revenues, costs and expenses are included in our Consolidated Financial Statements beginning as of the initial
acquisition date. Revenues in 2009 declined approximately 27% from 2008 (including periods in 2008 prior to our acquisition).
The revenue decline in 2009 reflected the impact of the recession which led to lower customer demand across all sectors, and
particularly in the Building Wire, Engineered Wire and Cable, Flow Products and Distribution Services sectors. Pre-tax earnings
in 2009 declined approximately 26% from the full year of 2008 which reflects the decline in revenues, somewhat offset by a
$160 million reduction in operating costs resulting from cost reduction efforts. In 2009, the Retail Store Fixtures, Food Service
Equipment and Water Treatment sectors produced comparable or improved earnings with 2008 despite lower revenues. The
remaining sectors experienced lower earnings in 2009 compared to 2008.
70