Berkshire Hathaway 2009 Annual Report Download - page 62
Download and view the complete annual report
Please find page 62 of the 2009 Berkshire Hathaway annual report below. You can navigate through the pages in the report by either clicking on the pages listed below, or by using the keyword search tool below to find specific information within the annual report.-
 1
1 -
2
-
3
-
4
-
5
-
6
-
7
-
8
-
9
-
10
-
11
-
12
-
13
-
14
-
15
-
16
-
17
-
18
-
19
-
20
-
21
-
22
-
23
-
24
-
25
-
26
-
27
-
28
-
29
-
30
-
31
-
32
-
33
-
34
-
35
-
36
-
37
-
38
-
39
-
40
-
41
-
42
-
43
-
44
-
45
-
46
-
47
-
48
-
49
-
50
-
51
-
 52
52 -
 53
53 -
 54
54 -
 55
55 -
 56
56 -
 57
57 -
 58
58 -
 59
59 -
 60
60 -
 61
61 -
 62
62 -
 63
63 -
 64
64 -
 65
65 -
 66
66 -
 67
67 -
 68
68 -
 69
69 -
 70
70 -
 71
71 -
 72
72 -
73
-
74
-
75
-
76
-
77
-
78
-
79
-
80
-
81
-
82
-
83
-
84
-
85
-
86
-
87
-
88
-
89
-
90
-
91
-
92
-
93
-
94
-
95
-
96
-
97
-
98
-
99
-
100
 |
 |

Notes to Consolidated Financial Statements (Continued)
(22) Business segment data (Continued)
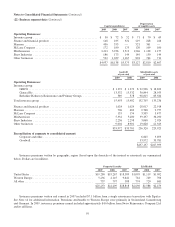
Consolidated sales and service revenues in 2009, 2008 and 2007 were $62.6 billion, $65.9 billion and $58.2 billion,
respectively. Approximately 90% of such amounts in each year were in the United States with the remainder primarily in
Canada and Europe. In 2009, consolidated sales and service revenues included $12.2 billion of sales to Wal-Mart Stores, Inc.
which were primarily related to McLane’s wholesale distribution business. At December 31, 2009, over 80% of our net
property, plant and equipment were located in the United States with the remainder primarily in Canada and Europe.
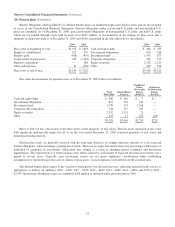
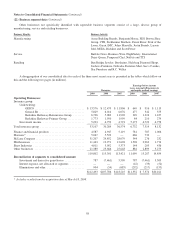
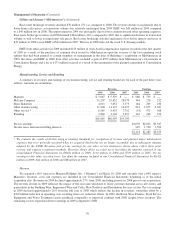
Premiums written and earned by the property/casualty and life/health insurance businesses are summarized below (in
millions).
Property/Casualty Life/Health
2009 2008 2007 2009 2008 2007
Premiums Written:
Direct .............................................. $16,484 $16,953 $16,056
Assumed ........................................... 9,321 7,960 13,316 $2,727 $2,690 $2,579
Ceded .............................................. (552) (704) (554) (97) (102) (100)
$25,253 $24,209 $28,818 $2,630 $2,588 $2,479
Premiums Earned:
Direct .............................................. $16,553 $16,269 $16,076
Assumed ........................................... 9,284 7,332 13,744 $2,723 $2,682 $2,564
Ceded .............................................. (579) (656) (499) (97) (102) (102)
$25,258 $22,945 $29,321 $2,626 $2,580 $2,462
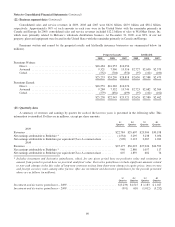
(23) Quarterly data
A summary of revenues and earnings by quarter for each of the last two years is presented in the following table. This
information is unaudited. Dollars are in millions, except per share amounts.
1st
Quarter
2nd
Quarter
3rd
Quarter
4th
Quarter
2009
Revenues ............................................................. $22,784 $29,607 $29,904 $30,198
Net earnings attributable to Berkshire * ..................................... (1,534) 3,295 3,238 3,056
Net earnings attributable to Berkshire per equivalent Class A common share ........ (990) 2,123 2,087 1,969
2008
Revenues ............................................................. $25,175 $30,093 $27,926 $24,592
Net earnings attributable to Berkshire * ..................................... 940 2,880 1,057 117
Net earnings attributable to Berkshire per equivalent Class A common share ........ 607 1,859 682 76
*Includes investment and derivative gains/losses, which, for any given period have no predictive value and variations in
amount from period to period have no practical analytical value. Derivative gains/losses include significant amounts related
to non-cash changes in the fair value of long-term contracts arising from short-term changes in equity prices, interest rates
and foreign currency rates, among other factors. After-tax investment and derivative gains/losses for the periods presented
above are as follows (in millions):
1st
Quarter
2nd
Quarter
3rd
Quarter
4th
Quarter
Investment and derivative gains/losses – 2009 .................................. $(3,239) $1,515 $ 1,183 $ 1,027
Investment and derivative gains/losses – 2008 .................................. (991) 610 (1,012) (3,252)
60