Berkshire Hathaway 2009 Annual Report Download - page 69
Download and view the complete annual report
Please find page 69 of the 2009 Berkshire Hathaway annual report below. You can navigate through the pages in the report by either clicking on the pages listed below, or by using the keyword search tool below to find specific information within the annual report.-
 1
1 -
2
-
3
-
4
-
5
-
6
-
7
-
8
-
9
-
10
-
11
-
12
-
13
-
14
-
15
-
16
-
17
-
18
-
19
-
20
-
21
-
22
-
23
-
24
-
25
-
26
-
27
-
28
-
29
-
30
-
31
-
32
-
33
-
34
-
35
-
36
-
37
-
38
-
39
-
40
-
41
-
42
-
43
-
44
-
45
-
46
-
47
-
48
-
49
-
50
-
51
-
52
-
53
-
54
-
55
-
56
-
57
-
58
-
 59
59 -
 60
60 -
 61
61 -
 62
62 -
 63
63 -
 64
64 -
 65
65 -
 66
66 -
 67
67 -
 68
68 -
 69
69 -
 70
70 -
 71
71 -
 72
72 -
 73
73 -
 74
74 -
 75
75 -
 76
76 -
 77
77 -
 78
78 -
 79
79 -
80
-
81
-
82
-
83
-
84
-
85
-
86
-
87
-
88
-
89
-
90
-
91
-
92
-
93
-
94
-
95
-
96
-
97
-
98
-
99
-
100
 |
 |

Management’s Discussion (Continued)
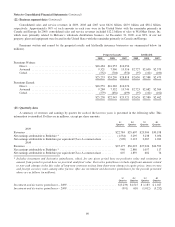
Insurance—Investment Income
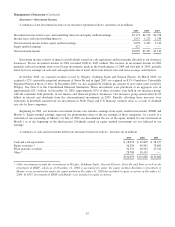
A summary of net investment income of our insurance operations follows. Amounts are in millions.
2009 2008 2007
Investment income before taxes, noncontrolling interests and equity method earnings ............ $5,173 $4,722 $4,758
Income taxes and noncontrolling interests ............................................... 1,515 1,225 1,248
Net investment income before equity method earnings ..................................... 3,658 3,497 3,510
Equity method earnings ............................................................. 427 — —
Net investment income .............................................................. $4,085 $3,497 $3,510
Investment income consists of interest and dividends earned on cash equivalents and investments allocable to our insurance
businesses. Pre-tax investment income in 2009 exceeded 2008 by $451 million. The increase in investment income in 2009
primarily reflected earnings from several large investments made in the fourth quarter of 2008 and first half of 2009, partially
offset by lower earnings on cash and cash equivalents due to lower short-term interest rates and lower average cash balances.
In October 2008, we acquired securities issued by Wrigley, Goldman Sachs and General Electric. In March 2009, we
acquired a 12% convertible perpetual instrument of Swiss Re and in April 2009, we acquired an 8.5% Cumulative Convertible
Perpetual Preferred Stock of Dow. In December 2009, we also acquired $1.0 billion par amount of new senior notes issued by
Wrigley. See Note 6 to the Consolidated Financial Statements. These investments were purchased at an aggregate cost of
approximately $21.1 billion. At December 31, 2009, approximately 85% of these securities were held in our insurance group,
with the remainder held primarily in our finance and financial products businesses. Our insurance group earned about $1.65
billion in interest and dividends from the aforementioned investments in 2009. Partially offsetting these increases were
reductions in dividends earned from our investments in Wells Fargo and U.S. Bancorp common stock as a result of dividend
rate cuts by those companies.
Beginning in 2009, our insurance investment income also includes earnings from equity method investments (BNSF and
Moody’s). Equity method earnings represent our proportionate share of the net earnings of these companies. As a result of a
reduction of our ownership of Moody’s in July of 2009, we discontinued the use of the equity method for our investment in
Moody’s as of the beginning of the third quarter. Dividends earned on equity method investments are not reflected in our
earnings.
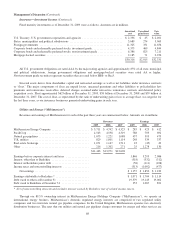
A summary of cash and investments held in our insurance businesses follows. Amounts are in millions.
2009 2008 2007
Cash and cash equivalents ..................................................... $ 18,655 $ 18,845 $ 28,257
Equity securities * ........................................................... 56,289 48,892 74,681
Fixed maturity securities ...................................................... 32,331 26,932 27,922
Other * .................................................................... 28,780 18,419 —
$136,055 $113,088 $130,860
*Other investments include the investments in Wrigley, Goldman Sachs, General Electric, Swiss Re and Dow as well as the
investment in BNSF, which as of December 31, 2008 is accounted for under the equity method. Berkshire’s investment in
Moody’s was accounted for under the equity method at December 31, 2008 but included in equity securities at December 31,
2009. In 2007, investments in BNSF and Moody’s are included in equity securities.
67