Berkshire Hathaway 2009 Annual Report Download - page 40
Download and view the complete annual report
Please find page 40 of the 2009 Berkshire Hathaway annual report below. You can navigate through the pages in the report by either clicking on the pages listed below, or by using the keyword search tool below to find specific information within the annual report.-
 1
1 -
2
-
3
-
4
-
5
-
6
-
7
-
8
-
9
-
10
-
11
-
12
-
13
-
14
-
15
-
16
-
17
-
18
-
19
-
20
-
21
-
22
-
23
-
24
-
25
-
26
-
27
-
28
-
29
-
 30
30 -
 31
31 -
 32
32 -
 33
33 -
 34
34 -
 35
35 -
 36
36 -
 37
37 -
 38
38 -
 39
39 -
 40
40 -
 41
41 -
 42
42 -
 43
43 -
 44
44 -
 45
45 -
 46
46 -
 47
47 -
 48
48 -
 49
49 -
 50
50 -
51
-
52
-
53
-
54
-
55
-
56
-
57
-
58
-
59
-
60
-
61
-
62
-
63
-
64
-
65
-
66
-
67
-
68
-
69
-
70
-
71
-
72
-
73
-
74
-
75
-
76
-
77
-
78
-
79
-
80
-
81
-
82
-
83
-
84
-
85
-
86
-
87
-
88
-
89
-
90
-
91
-
92
-
93
-
94
-
95
-
96
-
97
-
98
-
99
-
100
 |
 |

Notes to Consolidated Financial Statements (Continued)
(6) Other Investments (Continued)
common stock. Beginning in April 2014, if Dow’s common stock price exceeds $53.72 per share for any 20 trading days in a
consecutive 30-day window, Dow, at its option, at any time, in whole or in part, may convert the Dow Preferred into Dow
common stock at the then applicable conversion rate. The Dow Preferred is entitled to dividends at a rate of 8.5% per annum.
As of December 31, 2008, equity method investments included Burlington Northern Santa Fe Corporation (“BNSF”) and
Moody’s Corporation (“Moody’s”). During the fourth quarter of 2008, our investment in common stock and our related voting
interest in each of these companies exceeded 20%. Accordingly, we adopted the equity method of accounting with respect to
these investments as of December 31, 2008. Prior to December 31, 2008, these investments were accounted for as
available-for-sale equity securities and recorded in our financial statements at fair value. The cumulative effect of adopting the
equity method with respect to the investments in BNSF and Moody’s was recorded in our financial statements as of
December 31, 2008. Prior years’ financial statements were not restated due to immateriality.
As of December 31, 2009, we owned 22.5% of BNSF’s outstanding common stock. See Note 3 for additional information
regarding our acquisition of BNSF on February 12, 2010. As of December 31, 2009, our equity in net assets of BNSF was
$2,884 million and the excess of our carrying value over our equity in net assets of BNSF was $3,702 million.
During the third quarter of 2009, we sold shares of Moody’s common stock, which reduced our ownership and voting
interest to less than 20%. As a result, we discontinued the use of the equity method with respect to our investment in Moody’s
as of the beginning of the third quarter. As of December 31, 2009, our remaining investment in Moody’s common stock is
carried at fair value and included as a component of equity securities in the Consolidated Balance Sheet. This change did not
have a material impact on our Consolidated Financial Statements.
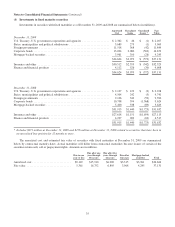
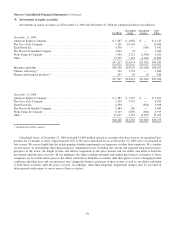
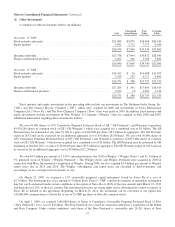
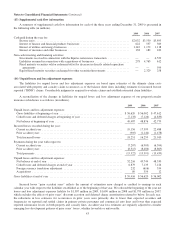
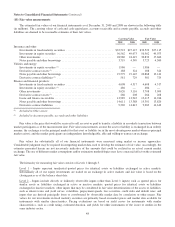
(7) Investment gains/losses
Investment gains/losses are summarized below (in millions).
2009 2008 2007
Fixed maturity securities —
Gross gains from sales and other disposals ........................................... $357 $ 212 $ 657
Gross losses from sales and other disposals .......................................... (54) (20) (35)
Equity securities —
Gross gains from sales and other disposals ........................................... 701 1,256 4,880
Gross losses from sales .......................................................... (617) (530) (7)
Other ............................................................................ (69) 255 103
$ 318 $1,173 $5,598
Net investment gains/losses are reflected in the Consolidated Statements of Earnings as follows.
Insurance and other ................................................................. $251 $1,166 $ 5,405
Finance and financial products ........................................................ 67 7 193
$ 318 $1,173 $ 5,598
38