Berkshire Hathaway 2009 Annual Report Download - page 66
Download and view the complete annual report
Please find page 66 of the 2009 Berkshire Hathaway annual report below. You can navigate through the pages in the report by either clicking on the pages listed below, or by using the keyword search tool below to find specific information within the annual report.-
 1
1 -
2
-
3
-
4
-
5
-
6
-
7
-
8
-
9
-
10
-
11
-
12
-
13
-
14
-
15
-
16
-
17
-
18
-
19
-
20
-
21
-
22
-
23
-
24
-
25
-
26
-
27
-
28
-
29
-
30
-
31
-
32
-
33
-
34
-
35
-
36
-
37
-
38
-
39
-
40
-
41
-
42
-
43
-
44
-
45
-
46
-
47
-
48
-
49
-
50
-
51
-
52
-
53
-
54
-
55
-
 56
56 -
 57
57 -
 58
58 -
 59
59 -
 60
60 -
 61
61 -
 62
62 -
 63
63 -
 64
64 -
 65
65 -
 66
66 -
 67
67 -
 68
68 -
 69
69 -
 70
70 -
 71
71 -
 72
72 -
 73
73 -
 74
74 -
 75
75 -
 76
76 -
77
-
78
-
79
-
80
-
81
-
82
-
83
-
84
-
85
-
86
-
87
-
88
-
89
-
90
-
91
-
92
-
93
-
94
-
95
-
96
-
97
-
98
-
99
-
100
 |
 |
Management’s Discussion (Continued)
Insurance—Underwriting (Continued)
General Re (Continued)
Property/casualty (Continued)
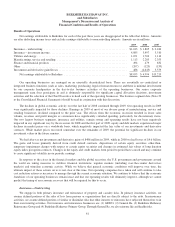
reserves and as a result, there was no impact on net underwriting gains in 2008. There was no similar transaction in 2009.
Excluding the reinsurance-to-close transaction and the effects of foreign currency exchange rate changes, premiums written in
2009 increased $149 million (4.7%) compared to 2008, primarily due to increased volume in North American, European treaty
and Lloyd’s market property business.
Premiums earned in 2009 declined $231 million (6.7%) from 2008. Excluding the effects of the reinsurance-to-close
transaction in 2008 and the effects of foreign currency exchange rate changes, premiums earned increased $107 million
(3.3%) in 2009 as compared to 2008. The increase in premiums earned in 2009 was primarily due to increased volume in
European treaty and Lloyd’s market property business. Increased price competition and capacity within the industry could lead
to a decline in our premium volume in 2010.
Underwriting results in 2009 included underwriting gains of $478 million from property business and losses of $178
million from casualty/workers’ compensation business. The property business produced underwriting gains of $173 million for
the 2009 accident year, and $305 million from loss reserve reductions related to pre-2009 loss events. The property gains in
2009 were net of $48 million of losses from catastrophes, which were primarily from winter storm Klaus in Europe, the Victoria
bushfires in Australia and an earthquake in Italy. The underwriting losses from casualty/workers’ compensation business were
primarily the result of establishing higher loss reserves for 2009 accident year occurrences to reflect higher loss trends as well as
$118 million of workers’ compensation loss reserve discount accretion and deferred charge amortization, offset in part by
reserve reductions related to prior years’ casualty and workers’ compensation loss reserves.
Premiums written and earned in 2008 declined compared with 2007. Premiums in 2007 included $114 million from a
reinsurance-to-close transaction which increased our economic interest in Lloyd’s Syndicate 435’s 2001 year of account to
100%. Otherwise, the declines in written and earned premiums in 2008 versus 2007 reflected underwriting discipline as the
volume of business accepted declined where pricing was considered inadequate.
Underwriting results in 2008 included $275 million in underwriting gains from property business partially offset by $112
million in underwriting losses from casualty/workers’ compensation business. The property business produced underwriting
losses of $120 million for the 2008 accident year, offset by $395 million of gains from loss reserve reductions related to
pre-2008 loss events. The 2008 accident year results included $174 million of catastrophe losses from Hurricanes Gustav and
Ike and $56 million of catastrophe losses from European storms. The underwriting losses from casualty/workers’ compensation
business in 2008 included $117 million of workers’ compensation loss reserve discount accretion and deferred charge
amortization, offset in part by reserve reductions related to prior years’ other casualty lines. The casualty results were adversely
impacted by legal costs incurred in connection with regulatory investigations of finite reinsurance.
Underwriting results in 2007 included $519 million in underwriting gains from property business partially offset by $44
million in underwriting losses from casualty/workers’ compensation business. The property business produced underwriting
gains of $90 million for the 2007 accident year and $429 million from loss reserve reductions related to pre-2007 loss events.
The pre-tax underwriting losses from casualty business in 2007 included $120 million of loss reserve discount accretion and
deferred charge amortization, as well as legal costs associated with finite reinsurance investigations. These charges were largely
offset by underwriting gains in other casualty business.
Life/health
Life and health reinsurance premiums earned in 2009 increased 1.8% over 2008, which increased 4.8% over 2007.
Excluding the effects of foreign currency, premiums earned increased 4.7% over 2008, which increased 2.2% over 2007. The
increase in premiums earned in 2009 was primarily due to international business. The increase in premiums earned in 2008 was
primarily from North American life business. Underwriting results for the global life/health operations produced underwriting
gains of $177 million in 2009, $179 million in 2008 and $80 million in 2007. Life/health results were profitable in each of the
past three years driven by gains from the life business due primarily to favorable mortality.
64