Berkshire Hathaway 2009 Annual Report Download - page 52
Download and view the complete annual report
Please find page 52 of the 2009 Berkshire Hathaway annual report below. You can navigate through the pages in the report by either clicking on the pages listed below, or by using the keyword search tool below to find specific information within the annual report.-
 1
1 -
2
-
3
-
4
-
5
-
6
-
7
-
8
-
9
-
10
-
11
-
12
-
13
-
14
-
15
-
16
-
17
-
18
-
19
-
20
-
21
-
22
-
23
-
24
-
25
-
26
-
27
-
28
-
29
-
30
-
31
-
32
-
33
-
34
-
35
-
36
-
37
-
38
-
39
-
40
-
41
-
 42
42 -
 43
43 -
 44
44 -
 45
45 -
 46
46 -
 47
47 -
 48
48 -
 49
49 -
 50
50 -
 51
51 -
 52
52 -
 53
53 -
 54
54 -
 55
55 -
 56
56 -
 57
57 -
 58
58 -
 59
59 -
 60
60 -
 61
61 -
 62
62 -
63
-
64
-
65
-
66
-
67
-
68
-
69
-
70
-
71
-
72
-
73
-
74
-
75
-
76
-
77
-
78
-
79
-
80
-
81
-
82
-
83
-
84
-
85
-
86
-
87
-
88
-
89
-
90
-
91
-
92
-
93
-
94
-
95
-
96
-
97
-
98
-
99
-
100
 |
 |

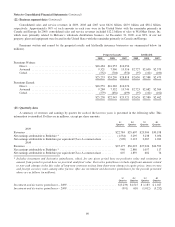
Notes to Consolidated Financial Statements (Continued)
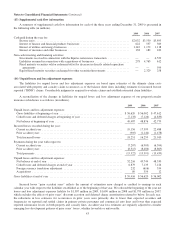
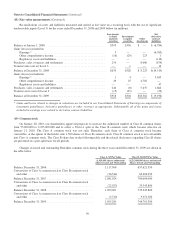
(18) Fair value measurements (Continued)
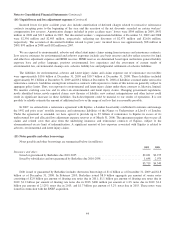
Reconciliations of assets and liabilities measured and carried at fair value on a recurring basis with the use of significant
unobservable inputs (Level 3) for the years ended December 31, 2008 and 2009 follow (in millions).
Investments
in fixed
maturity
securities
Investments
in equity
securities
Other
investments
Net
derivative
contract
liabilities
Balance at January 1, 2008 ......................................... $393 $356 $ — $ (6,784)
Gains (losses) included in:
Earnings * .................................................. 3 — — (6,765)
Other comprehensive income ................................... (16) (29) 223 1
Regulatory assets and liabilities .................................. — — — (110)
Purchases, sales, issuances and settlements ............................. 259 — 8,000 (874)
Transfers into (out of) Level 3 ....................................... — 1 — 13
Balance at December 31, 2008 ...................................... $639 $328 $ 8,223 $(14,519)
Gains (losses) included in:
Earnings * .................................................. 1 4 — 3,635
Other comprehensive income ................................... 49 25 4,702 —
Regulatory assets and liabilities .................................. — — — 47
Purchases, sales, issuances and settlements ............................. 244 (8) 5,637 1,664
Transfers in to (out of) Level 3 ...................................... (15) (45) — (23)
Balance at December 31, 2009 ...................................... $918 $304 $18,562 $ (9,196)
* Gains and losses related to changes in valuations are included in our Consolidated Statements of Earnings as components of
investment gains/losses, derivative gains/losses or other revenues as appropriate. Substantially all of the gains and losses
included in earnings were related to derivative contract liabilities.
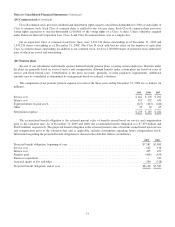
(19) Common stock
On January 20, 2010, our shareholders approved proposals to increase the authorized number of Class B common shares
from 55,000,000 to 3,225,000,000 and to effect a 50-for-1 split of the Class B common stock which became effective on
January 21, 2010. The Class A common stock was not split. Thereafter, each share of Class A common stock became
convertible, at the option of the holder, into 1,500 shares of Class B common stock. Class B common stock is not convertible
into Class A common stock. The Class B share data in the following table and the related disclosures regarding Class B shares
are presented on a post-split basis for all periods.
Changes in issued and outstanding Berkshire common stock during the three years ended December 31, 2009 are shown in
the table below.
Class A, $5 Par Value Class B, $0.0033 Par Value
(1,650,000 shares authorized)
Shares Issued and Outstanding
(3,225,000,000 shares authorized)
Shares Issued and Outstanding
Balance December 31, 2006 ................................ 1,117,568 637,621,550
Conversions of Class A common stock to Class B common stock
and other ............................................. (36,544) 62,382,450
Balance December 31, 2007 ................................ 1,081,024 700,004,000
Conversions of Class A common stock to Class B common stock
and other ............................................. (22,023) 35,345,800
Balance December 31, 2008 ................................ 1,059,001 735,349,800
Conversions of Class A common stock to Class B common stock
and other ............................................. (3,720) 9,351,500
Balance December 31, 2009 ................................ 1,055,281 744,701,300
50