Berkshire Hathaway 2009 Annual Report Download - page 28
Download and view the complete annual report
Please find page 28 of the 2009 Berkshire Hathaway annual report below. You can navigate through the pages in the report by either clicking on the pages listed below, or by using the keyword search tool below to find specific information within the annual report.-
 1
1 -
2
-
3
-
4
-
5
-
6
-
7
-
8
-
9
-
10
-
11
-
12
-
13
-
14
-
15
-
16
-
17
-
 18
18 -
 19
19 -
 20
20 -
 21
21 -
 22
22 -
 23
23 -
 24
24 -
 25
25 -
 26
26 -
 27
27 -
 28
28 -
 29
29 -
 30
30 -
 31
31 -
 32
32 -
 33
33 -
 34
34 -
 35
35 -
 36
36 -
 37
37 -
 38
38 -
39
-
40
-
41
-
42
-
43
-
44
-
45
-
46
-
47
-
48
-
49
-
50
-
51
-
52
-
53
-
54
-
55
-
56
-
57
-
58
-
59
-
60
-
61
-
62
-
63
-
64
-
65
-
66
-
67
-
68
-
69
-
70
-
71
-
72
-
73
-
74
-
75
-
76
-
77
-
78
-
79
-
80
-
81
-
82
-
83
-
84
-
85
-
86
-
87
-
88
-
89
-
90
-
91
-
92
-
93
-
94
-
95
-
96
-
97
-
98
-
99
-
100
 |
 |

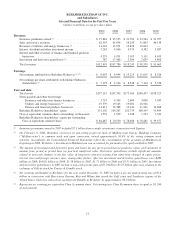
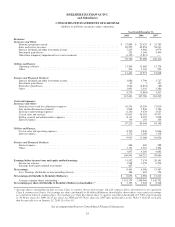
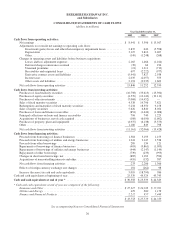
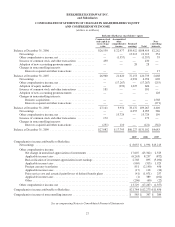
BERKSHIRE HATHAWAY INC.
and Subsidiaries
CONSOLIDATED STATEMENTS OF CASH FLOWS
(dollars in millions)
Year Ended December 31,
2009 2008 2007
Cash flows from operating activities:
Net earnings ............................................................. $ 8,441 $ 5,596 $ 13,567
Adjustments to reconcile net earnings to operating cash flows:
Investment (gains) losses and other-than-temporary impairment losses ........... 2,837 640 (5,598)
Depreciation ......................................................... 3,127 2,810 2,407
Other ............................................................... (149) (1,248) (268)
Changes in operating assets and liabilities before business acquisitions:
Losses and loss adjustment expenses ...................................... 2,165 1,466 (1,164)
Deferred charges reinsurance assumed .................................... (39) 64 196
Unearned premiums ................................................... (21) 1,311 (713)
Receivables and originated loans ......................................... 697 (2,222) (977)
Derivative contract assets and liabilities ................................... (5,441) 7,827 2,938
Income taxes ......................................................... 2,035 (2,057) 553
Other assets and liabilities .............................................. 2,194 (2,935) 1,609
Net cash flows from operating activities ....................................... 15,846 11,252 12,550
Cash flows from investing activities:
Purchases of fixed maturity securities ......................................... (10,798) (35,615) (13,394)
Purchases of equity securities ............................................... (4,570) (10,140) (19,111)
Purchases of other investments .............................................. (7,068) (14,452) —
Sales of fixed maturity securities ............................................. 4,338 14,796 7,821
Redemptions and maturities of fixed maturity securities ........................... 5,234 18,550 9,158
Sales of equity securities ................................................... 5,626 6,840 8,054
Purchases of loans and finance receivables ..................................... (854) (1,446) (1,008)
Principal collections on loans and finance receivables ............................ 796 740 1,229
Acquisitions of businesses, net of cash acquired ................................. (108) (6,050) (1,602)
Purchases of property, plant and equipment .................................... (4,937) (6,138) (5,373)
Other ................................................................... 1,180 849 798
Net cash flows from investing activities ....................................... (11,161) (32,066) (13,428)
Cash flows from financing activities:
Proceeds from borrowings of finance businesses ................................ 1,584 5,195 1,153
Proceeds from borrowings of utilities and energy businesses ....................... 1,241 2,147 3,538
Proceeds from other borrowings ............................................. 289 134 121
Repayments of borrowings of finance businesses ................................ (403) (3,861) (1,093)
Repayments of borrowings of utilities and energy businesses ....................... (444) (2,147) (1,149)
Repayments of other borrowings ............................................. (739) (233) (995)
Changes in short term borrowings, net ........................................ (885) 1,183 (596)
Acquisitions of noncontrolling interests and other ............................... (410) (132) 387
Net cash flows from financing activities ....................................... 233 2,286 1,366
Effects of foreign currency exchange rate changes ............................... 101 (262) 98
Increase (decrease) in cash and cash equivalents ................................. 5,019 (18,790) 586
Cash and cash equivalents at beginning of year ...................................... 25,539 44,329 43,743
Cash and cash equivalents at end of year * ....................................... $30,558 $ 25,539 $ 44,329
* Cash and cash equivalents at end of year are comprised of the following:
Insurance and Other ....................................................... $ 27,917 $ 24,302 $ 37,703
Utilities and Energy ....................................................... 429 280 1,178
Finance and Financial Products ............................................. 2,212 957 5,448
$ 30,558 $ 25,539 $ 44,329
See accompanying Notes to Consolidated Financial Statements
26