Berkshire Hathaway 2009 Annual Report Download - page 27
Download and view the complete annual report
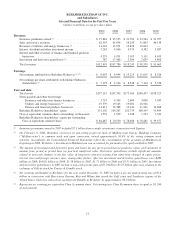
Please find page 27 of the 2009 Berkshire Hathaway annual report below. You can navigate through the pages in the report by either clicking on the pages listed below, or by using the keyword search tool below to find specific information within the annual report.-
 1
1 -
2
-
3
-
4
-
5
-
6
-
7
-
8
-
9
-
10
-
11
-
12
-
13
-
14
-
15
-
16
-
 17
17 -
 18
18 -
 19
19 -
 20
20 -
 21
21 -
 22
22 -
 23
23 -
 24
24 -
 25
25 -
 26
26 -
 27
27 -
 28
28 -
 29
29 -
 30
30 -
 31
31 -
 32
32 -
 33
33 -
 34
34 -
 35
35 -
 36
36 -
 37
37 -
38
-
39
-
40
-
41
-
42
-
43
-
44
-
45
-
46
-
47
-
48
-
49
-
50
-
51
-
52
-
53
-
54
-
55
-
56
-
57
-
58
-
59
-
60
-
61
-
62
-
63
-
64
-
65
-
66
-
67
-
68
-
69
-
70
-
71
-
72
-
73
-
74
-
75
-
76
-
77
-
78
-
79
-
80
-
81
-
82
-
83
-
84
-
85
-
86
-
87
-
88
-
89
-
90
-
91
-
92
-
93
-
94
-
95
-
96
-
97
-
98
-
99
-
100
 |
 |

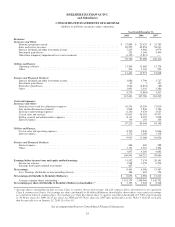
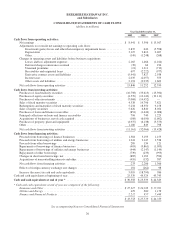
BERKSHIRE HATHAWAY INC.
and Subsidiaries
CONSOLIDATED STATEMENTS OF EARNINGS
(dollars in millions except per share amounts)
Year Ended December 31,
2009 2008 2007
Revenues:
Insurance and Other:
Insurance premiums earned ...................................................... $ 27,884 $ 25,525 $ 31,783
Sales and service revenues ....................................................... 62,555 65,854 58,243
Interest, dividend and other investment income ....................................... 5,245 4,966 4,979
Investment gains/losses .......................................................... 251 1,166 5,405
Other-than-temporary impairment losses on investments ............................... (3,155) (1,813) —
92,780 95,698 100,410
Utilities and Energy:
Operating revenues ............................................................. 11,204 12,668 12,376
Other ........................................................................ 239 1,303 252
11,443 13,971 12,628
Finance and Financial Products:
Interest, dividend and other investment income ....................................... 1,886 1,790 1,717
Investment gains/losses .......................................................... 67 7 193
Derivative gains/losses .......................................................... 3,624 (6,821) (89)
Other ........................................................................ 2,693 3,141 3,386
8,270 (1,883) 5,207
112,493 107,786 118,245
Costs and expenses:
Insurance and Other:
Insurance losses and loss adjustment expenses ....................................... 18,251 16,259 21,010
Life and health insurance benefits ................................................. 1,838 1,840 1,786
Insurance underwriting expenses .................................................. 6,236 4,634 5,613
Cost of sales and services ........................................................ 52,647 54,103 47,477
Selling, general and administrative expenses ......................................... 8,117 8,052 7,098
Interest expense ................................................................ 130 156 164
87,219 85,044 83,148
Utilities and Energy:
Cost of sales and operating expenses ............................................... 8,739 9,840 9,696
Interest expense ................................................................ 1,176 1,168 1,158
9,915 11,008 10,854
Finance and Financial Products:
Interest expense ................................................................ 686 639 588
Other ........................................................................ 3,121 3,521 3,494
3,807 4,160 4,082
100,941 100,212 98,084
Earnings before income taxes and equity method earnings ............................... 11,552 7,574 20,161
Income tax expense ............................................................. 3,538 1,978 6,594
Earnings from equity method investments ........................................... 427 — —
Net earnings ...................................................................... 8,441 5,596 13,567
Less: Earnings attributable to noncontrolling interests .................................. 386 602 354
Net earnings attributable to Berkshire Hathaway ....................................... $ 8,055 $ 4,994 $ 13,213
Average common shares outstanding * ............................................. 1,551,174 1,548,960 1,545,751
Net earnings per share attributable to Berkshire Hathaway shareholders * ................. $ 5,193 $ 3,224 $ 8,548
* Average shares outstanding include average Class A common shares and average Class B common shares determined on an equivalent
Class A common stock basis. Net earnings per share attributable to Berkshire Hathaway shareholders shown above represents net earnings
per equivalent Class A common share. Net earnings per Class B common share is equal to one-fifteen-hundredth (1/1,500) of such amount
or $3.46 per share for 2009, $2.15 per share for 2008 and $5.70 per share for 2007 after giving effect to the 50-for-1 Class B stock split
that became effective on January 21, 2010. See Note 19.
See accompanying Notes to Consolidated Financial Statements
25