BP 2007 Annual Report Download - page 57
Download and view the complete annual report
Please find page 57 of the 2007 BP annual report below. You can navigate through the pages in the report by either clicking on the pages listed below, or by using the keyword search tool below to find specific information within the annual report.-
 1
1 -
2
-
3
-
4
-
5
-
6
-
7
-
8
-
9
-
10
-
11
-
12
-
13
-
14
-
15
-
16
-
17
-
18
-
19
-
20
-
21
-
22
-
23
-
24
-
25
-
26
-
27
-
28
-
29
-
30
-
31
-
32
-
33
-
34
-
35
-
36
-
37
-
38
-
39
-
40
-
41
-
42
-
43
-
44
-
45
-
46
-
 47
47 -
 48
48 -
 49
49 -
 50
50 -
 51
51 -
 52
52 -
 53
53 -
 54
54 -
 55
55 -
 56
56 -
 57
57 -
 58
58 -
 59
59 -
 60
60 -
 61
61 -
 62
62 -
 63
63 -
 64
64 -
 65
65 -
 66
66 -
 67
67 -
68
-
69
-
70
-
71
-
72
-
73
-
74
-
75
-
76
-
77
-
78
-
79
-
80
-
81
-
82
-
83
-
84
-
85
-
86
-
87
-
88
-
89
-
90
-
91
-
92
-
93
-
94
-
95
-
96
-
97
-
98
-
99
-
100
-
101
-
102
-
103
-
104
-
105
-
106
-
107
-
108
-
109
-
110
-
111
-
112
-
113
-
114
-
115
-
116
-
117
-
118
-
119
-
120
-
121
-
122
-
123
-
124
-
125
-
126
-
127
-
128
-
129
-
130
-
131
-
132
-
133
-
134
-
135
-
136
-
137
-
138
-
139
-
140
-
141
-
142
-
143
-
144
-
145
-
146
-
147
-
148
-
149
-
150
-
151
-
152
-
153
-
154
-
155
-
156
-
157
-
158
-
159
-
160
-
161
-
162
-
163
-
164
-
165
-
166
-
167
-
168
-
169
-
170
-
171
-
172
-
173
-
174
-
175
-
176
-
177
-
178
-
179
-
180
-
181
-
182
-
183
-
184
-
185
-
186
-
187
-
188
-
189
-
190
-
191
-
192
-
193
-
194
-
195
-
196
-
197
-
198
-
199
-
200
-
201
-
202
-
203
-
204
-
205
-
206
-
207
-
208
-
209
-
210
-
211
-
212
 |
 |

BP ANNUAL REPORT AND ACCOUNTS 2007 55
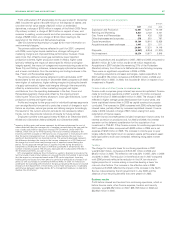
During 2007, the company repurchased 663 million of its own shares Forward-looking statements on page 11 and Risk factors on pages 9-10,
for cancellation at a cost of $7.5 billion. The repurchased shares had a which describe the risks and uncertainties that may cause actual results
nominal value of $166 million and represented 3.4% of ordinary shares and developments to differ materially from those expressed or implied by
in issue, net of treasury shares, at the end of 2006. Since the inception these forward-looking statements. The company provides no
of the share repurchase programme in 2000, we have repurchased commitment to update the forward-looking statements or to publish
4,659 million shares at a cost of $48.2 billion. financial projections for forward-looking statements in the future.
Our dividend policy has been to grow the dividend per share
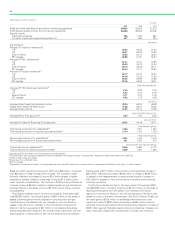
progressively, guided by several considerations including the prevailing Financing the group’s activities
circumstances of the group, the future investment patterns and The group’s principal commodity, oil, is priced internationally in US
sustainability of the group and the trading environment. We have also dollars. Group policy has been to minimize economic exposure to
been committed to returning all free cash flows in excess of dividend currency movements by financing operations with US dollar debt
needs to our shareholders. These broad principles remain, but changes in wherever possible, otherwise by using currency swaps when funds
our business and the trading environment have given us greater have been raised in currencies other than US dollars.
confidence in our future cash flows and have led us to rebalance the The group’s finance debt is almost entirely in US dollars and at
uses of this cash. 31 December 2007 amounted to $31,045 million (2006 $24,010 million)
We now hold a more positive view of the pricing environment, of which $15,394 million (2006 $12,924 million) was short term.
especially for oil, and we expect our financial performance will be Net debt was $27,483 million at the end of 2007, an increase of
boosted by growing revenues, increased production and improved $6,063 million compared with 2006. The ratio of net debt to net debt
refining availability. We also see significant potential for cost efficiencies plus equity was 23% at the end of 2007 and 20% at the end of 2006.
and improved performance across all our businesses. Our reduced equity The maturity profile and fixed/floating rate characteristics of the
base, resulting from our share buyback programme, has made per-share group’s debt are described in Financial statements – Note 28 on page 136
dividend increases more affordable. In light of these factors, we have andNote35onpage148.
decided to increase organic capital expenditure (that is capital We have in place a European Debt Issuance Programme (DIP) under
expenditure excluding acquisitions and assets exchanges) to support which the group may raise $15 billion of debt for maturities of one month
growth, and to rebalance our distributions between dividends and share or longer. At 31 December 2007, the amount drawn down against the
buybacks. We continue to believe that a gearing band of 20-30% DIP was $10,438 million.
provides an efficient capital structure and the appropriate level of financial In addition, the group has in place a US Shelf Registration under which
flexibility. Taken together, these factors led us to increase the dividend it may raise $10 billion of debt with maturities of one month or longer. At
by 25% for the fourth quarter, compared with the third quarter. As a 31 December 2007 the amount raised under the US Shelf Registration
result, the level of free cash flow allocated to share buybacks is likely to was $2,500 million.
be lower. We will, however, continue to use share buybacks as a Commercial paper markets in the US and Europe are a primary source
mechanism to return excess cash to shareholders when appropriate and of liquidity for the group. At 31 December 2007, the outstanding
subject to renewed authority at the April 2008 annual general meeting. commercial paper amounted to $5,881 million.
At 31 December 2007, gearing was 23%, towards the bottom of the The group also has access to significant sources of liquidity in the
targeted band. form of committed facilities and other funding through the capital
BP intends to continue the operation of the Dividend Reinvestment markets. At 31 December 2007, the group had available undrawn
Plan (DRIP) for shareholders who wish to receive their dividend in the committed borrowing facilities of $4,950 million ($4,700 million at
form of shares rather than cash. The BP Direct Access Plan for US and 31 December 2006).
Canadian shareholders also includes a dividend reinvestment feature. BP believes that, taking into account the substantial amounts of
The discussion above and following contains forward-looking undrawn borrowing facilities available, the group has sufficient working
statements with regard to future production, future refining availability, capital for foreseeable requirements.
future capital expenditure, sources of funding, future revenues and
financial performance, potential for cost efficiencies, level of free cash Off-balance sheet arrangements
flow allocated to share buybacks, shareholder distributions and share In addition to reported debt, BP uses conventional off-balance sheet
buybacks, gearing, working capital and expected payments under arrangements such as operating leases and borrowings in jointly
contractual and commercial commitments. These forward-looking controlled entities and associates. At 31 December 2007, the group’s
statements are based on assumptions that management believes to be share of third-party finance debt of jointly controlled entities and
reasonable in the light of the group’s operational and financial experience. associates was $5,894 million (2006 $4,942 million) and $870 million
However, no assurance can be given that the forward-looking statements (2006 $1,143 million) respectively. These amounts are not reflected in
will be realized. You are urged to read the cautionary statement under the group’s debt on the balance sheet.
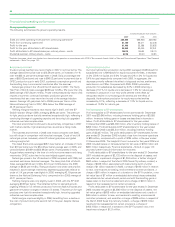
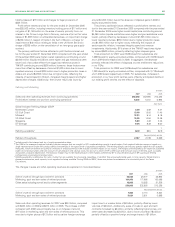
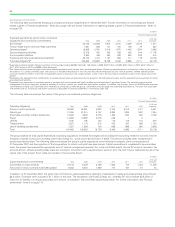
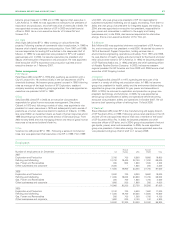
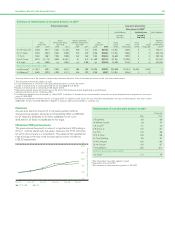
The group has issued third-party guarantees under which amounts outstanding at 31 December 2007 are summarized below. Some guarantees
outstanding are in respect of borrowings of jointly controlled entities and associates noted above. The analysis by time period indicates the ultimate
expiry of the guarantees.
$ million
--------------------------------------------------------------------------------------------------------------------------------------------------------------------------------------------------------------------------------------------------------------------------------------------------------
Guarantees expiring by period
--------------------------------------------------------------------------------------------------------------------------------------------------------------------------------------------------------------------------------------------------------------------------------------------------------
2013 and
Total 2008 2009 2010 2011 2012 thereafter
--------------------------------------------------------------------------------------------------------------------------------------------------------------------------------------------------------------------------------------------------------------------------------------------------------
Guarantees issued in respect ofa
Liabilities and borrowings of jointly controlled entities and associates 443 18019 6 356 179
Liabilities and borrowings of other third parties 601832710 7 7 467
aOf the amounts shown in the table, $284 million of the jointly controlled entities and associates guarantees relate to guarantees of borrowings and for other third parties
guarantees $574 million relates to guarantees of borrowings.