BP 2007 Annual Report Download - page 16
Download and view the complete annual report
Please find page 16 of the 2007 BP annual report below. You can navigate through the pages in the report by either clicking on the pages listed below, or by using the keyword search tool below to find specific information within the annual report.-
 1
1 -
2
-
3
-
4
-
5
-
 6
6 -
 7
7 -
 8
8 -
 9
9 -
 10
10 -
 11
11 -
 12
12 -
 13
13 -
 14
14 -
 15
15 -
 16
16 -
 17
17 -
 18
18 -
 19
19 -
 20
20 -
 21
21 -
 22
22 -
 23
23 -
 24
24 -
 25
25 -
 26
26 -
27
-
28
-
29
-
30
-
31
-
32
-
33
-
34
-
35
-
36
-
37
-
38
-
39
-
40
-
41
-
42
-
43
-
44
-
45
-
46
-
47
-
48
-
49
-
50
-
51
-
52
-
53
-
54
-
55
-
56
-
57
-
58
-
59
-
60
-
61
-
62
-
63
-
64
-
65
-
66
-
67
-
68
-
69
-
70
-
71
-
72
-
73
-
74
-
75
-
76
-
77
-
78
-
79
-
80
-
81
-
82
-
83
-
84
-
85
-
86
-
87
-
88
-
89
-
90
-
91
-
92
-
93
-
94
-
95
-
96
-
97
-
98
-
99
-
100
-
101
-
102
-
103
-
104
-
105
-
106
-
107
-
108
-
109
-
110
-
111
-
112
-
113
-
114
-
115
-
116
-
117
-
118
-
119
-
120
-
121
-
122
-
123
-
124
-
125
-
126
-
127
-
128
-
129
-
130
-
131
-
132
-
133
-
134
-
135
-
136
-
137
-
138
-
139
-
140
-
141
-
142
-
143
-
144
-
145
-
146
-
147
-
148
-
149
-
150
-
151
-
152
-
153
-
154
-
155
-
156
-
157
-
158
-
159
-
160
-
161
-
162
-
163
-
164
-
165
-
166
-
167
-
168
-
169
-
170
-
171
-
172
-
173
-
174
-
175
-
176
-
177
-
178
-
179
-
180
-
181
-
182
-
183
-
184
-
185
-
186
-
187
-
188
-
189
-
190
-
191
-
192
-
193
-
194
-
195
-
196
-
197
-
198
-
199
-
200
-
201
-
202
-
203
-
204
-
205
-
206
-
207
-
208
-
209
-
210
-
211
-
212
 |
 |

Exploration and Production
Our Exploration and Production segment includes upstream and
midstream activities in 29 countries, including the US, the UK, Angola,
Azerbaijan, Canada, Egypt, Russia, Trinidad & Tobago (Trinidad) and
locations within Asia Pacific, Latin America, North Africa and the Middle
East. Upstream activities involve oil and natural gas exploration and field
development and production. Our exploration programme is currently
focused around the deepwater Gulf of Mexico, Algeria, Angola,
Azerbaijan, Egypt and Russia. Major development areas include the
deepwater Gulf of Mexico, Azerbaijan, Algeria, Angola, Egypt and Asia
Pacific. During 2007, production came from 22 countries. The principal
areas of production are Russia, the US, Trinidad, the UK, Latin America,
the Middle East, Asia Pacific, Azerbaijan, Angola and Egypt.
Midstream activities involve the ownership and management of crude
oil and natural gas pipelines, processing and export terminals and LNG
processing facilities and transportation. Our most significant midstream
pipeline interests include the Trans Alaska Pipeline System, the Forties
Pipeline System and the Central Area Transmission System pipeline,
both in the UK sector of the North Sea, and the Baku-Tbilisi-Ceyhan
pipeline, running through Azerbaijan, Georgia and Turkey. Major LNG
activities are located in Trinidad, Indonesia and Australia. Further LNG
businesses with BP involvement are being built up in Egypt and Angola.
Our oil and gas production assets are located onshore or offshore and
include wells, gathering centres, in-field flow lines, processing facilities,
storage facilities, offshore platforms, export systems (e.g. transit lines),
pipelines and LNG plant facilities.
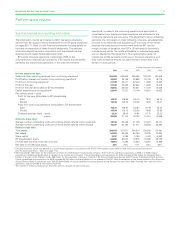
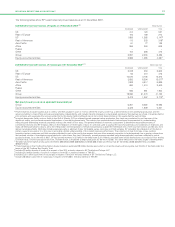
Key statistics $million
------------------------------------------------------------------------------------------------------------------------------------------------
2007 2006 2005
------------------------------------------------------------------------------------------------------------------------------------------------
Sales and other operating revenues
from continuing operations 54,550 52,600 47,210
Profit before interest and tax from
continuing operationsa26,938 29,629 25,502
Total assets 108,874 99,310 93,447
Capital expenditure and acquisitions 13,906 13,118 10,237
million barrels of oil equivalent
------------------------------------------------------------------------------------------------------------------------------------------------
Net proved reserves – group 12,583 13,163 14,023
Net proved reserves – equity-
accounted entities 5,231 4,537 3,870
thousand barrels per day
------------------------------------------------------------------------------------------------------------------------------------------------
Liquids production – group 1,304 1,351 1,423
Liquids production – equity-
accounted entities 1,110 1,124 1,139
million cubic feet per day
------------------------------------------------------------------------------------------------------------------------------------------------
Natural gas production – group 7,222 7,412 7,512
Natural gas production – equity-
accounted entities 921 1,005 912
$ per barrel
------------------------------------------------------------------------------------------------------------------------------------------------
Average BP crude oil realizationsb69.98 61.91 50.27
Average BP NGL realizationsb46.20 37.17 33.23
Average BP liquids realizationsbc 67.45 59.23 48.51
Average West Texas Intermediate
oil price 72.20 66.02 56.58
Average Brent oil price 72.39 65.14 54.48
$ per thousand cubic feet
------------------------------------------------------------------------------------------------------------------------------------------------
Average BP natural gas realizationsb4.53 4.72 4.90
Average BP US natural gas
realizationsb5.43 5.74 6.78
$ per million British thermal units
------------------------------------------------------------------------------------------------------------------------------------------------
Average Henry Hub gas priced6.86 7.24 8.65
pence per therm
------------------------------------------------------------------------------------------------------------------------------------------------
Average UK National Balancing Point
gas price 29.95 42.19 40.71
aProfit before interest and tax from continuing operations includes profit after
interest and tax of equity-accounted entities.
bThe Exploration and Production segment does not undertake any hedging activity.
Consequently, realizations reflect the market price achieved. Realizations are based
on sales of consolidated subsidiaries only, which excludes equity-accounted
entities.
cCrude oil and natural gas liquids.
dHenry Hub First of Month Index.
Upstream operations in Argentina, Bolivia, Abu Dhabi, Kazakhstan and
the TNK-BP and some of the Sakhalin operations in Russia, as well as
some of our operations in Indonesia and Venezuela, are conducted
through equity-accounted entities.
The Exploration and Production strategy is to build production by:
– Focusing on finding the largest fields in the world’s most prolific
hydrocarbon basins.
– Building leadership positions in these areas.
– Managing the decline of existing producing assets and divesting
assets when they no longer compete in our portfolio.
Through the application of advanced technology and significant
investment, we have gained a strong position in many of our operating
areas.
Total capital expenditure and acquisitions in 2007 was $13.9 billion
(2006 $13.1 billion and 2005 $10.2 billion). There were no significant
acquisitions in the period from 2005 to 2007. Capital expenditure in 2006
included our investment in Rosneft’s IPO of $1 billion. Capital
expenditure in 2008 is planned to be around $15 billion including
approximately $0.5 billion in respect of the gas and power businesses
that are now reported through Exploration and Production, as described
below, and excluding the impact of our transaction with Husky Energy
Inc., which is further described on page 22. This reflects our project
programme, managed within the context of our disciplined approach to
capital investment and taking into account sector-specific inflation.
Development expenditure incurred in 2007, excluding midstream
activities, was $10,153 million, compared with $9,109 million in 2006 and
$7,678 million in 2005.
Resegmentation in 2008
With effect from 1 January 2008, the NGLs, LNG and the gas and power
marketing and trading businesses were transferred from the Gas, Power
and Renewables segment to the Exploration and Production segment.
Upstream activities
Exploration
The group explores for oil and natural gas under a wide range of
licensing, joint venture and other contractual agreements. We may do
this alone or, more frequently, with partners. BP acts as operator for
many of these ventures.
Our exploration and appraisal costs in 2007 were $1,892 million,
compared with $1,765 million in 2006 and $1,266 million in 2005. These
costs include exploration and appraisal drilling expenditures, which are
capitalized within intangible fixed assets, and geological and geophysical
exploration costs, which are charged to income as incurred.
Approximately 47% of 2007 exploration and appraisal costs were
directed towards appraisal activity. In 2007, we participated in 86 gross
(37 net) exploration and appraisal wells in 12 countries. The principal
areas of activity were the deepwater Gulf of Mexico, Angola, Egypt,
North Sea, Canada and Pakistan.
Total exploration expense in 2007 of $756 million (2006 $1,045 million
and 2005 $684 million) included the write-off of expenses related to
14