BP 2007 Annual Report Download - page 143
Download and view the complete annual report
Please find page 143 of the 2007 BP annual report below. You can navigate through the pages in the report by either clicking on the pages listed below, or by using the keyword search tool below to find specific information within the annual report.-
 1
1 -
2
-
3
-
4
-
5
-
6
-
7
-
8
-
9
-
10
-
11
-
12
-
13
-
14
-
15
-
16
-
17
-
18
-
19
-
20
-
21
-
22
-
23
-
24
-
25
-
26
-
27
-
28
-
29
-
30
-
31
-
32
-
33
-
34
-
35
-
36
-
37
-
38
-
39
-
40
-
41
-
42
-
43
-
44
-
45
-
46
-
47
-
48
-
49
-
50
-
51
-
52
-
53
-
54
-
55
-
56
-
57
-
58
-
59
-
60
-
61
-
62
-
63
-
64
-
65
-
66
-
67
-
68
-
69
-
70
-
71
-
72
-
73
-
74
-
75
-
76
-
77
-
78
-
79
-
80
-
81
-
82
-
83
-
84
-
85
-
86
-
87
-
88
-
89
-
90
-
91
-
92
-
93
-
94
-
95
-
96
-
97
-
98
-
99
-
100
-
101
-
102
-
103
-
104
-
105
-
106
-
107
-
108
-
109
-
110
-
111
-
112
-
113
-
114
-
115
-
116
-
117
-
118
-
119
-
120
-
121
-
122
-
123
-
124
-
125
-
126
-
127
-
128
-
129
-
130
-
131
-
132
-
 133
133 -
 134
134 -
 135
135 -
 136
136 -
 137
137 -
 138
138 -
 139
139 -
 140
140 -
 141
141 -
 142
142 -
 143
143 -
 144
144 -
 145
145 -
 146
146 -
 147
147 -
 148
148 -
 149
149 -
 150
150 -
 151
151 -
 152
152 -
 153
153 -
154
-
155
-
156
-
157
-
158
-
159
-
160
-
161
-
162
-
163
-
164
-
165
-
166
-
167
-
168
-
169
-
170
-
171
-
172
-
173
-
174
-
175
-
176
-
177
-
178
-
179
-
180
-
181
-
182
-
183
-
184
-
185
-
186
-
187
-
188
-
189
-
190
-
191
-
192
-
193
-
194
-
195
-
196
-
197
-
198
-
199
-
200
-
201
-
202
-
203
-
204
-
205
-
206
-
207
-
208
-
209
-
210
-
211
-
212
 |
 |

BP ANNUAL REPORT AND ACCOUNTS 2007 141
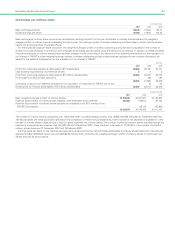
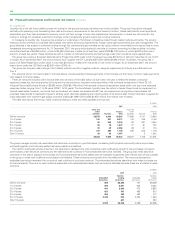
28 Financial instruments and financial risk factors continued
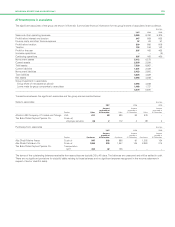
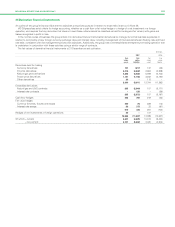
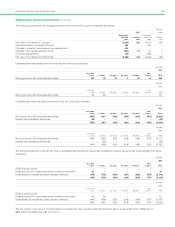
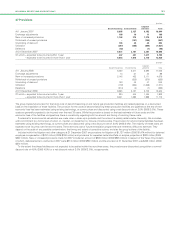
The table below shows cash outflows for derivative hedging instruments based upon contractual payment dates. The amounts reflect the maturity
profile of the fair value liability where the instruments will be settled net, and the gross settlement amount where the pay leg of a derivative will be
settled separately to the receive leg, as in the case of cross-currency interest rate swaps hedging non-US dollar finance debt. The swaps are with high
investment-grade counterparties and therefore the settlement day risk exposure is considered to be negligible.
$ million
--------------------------------------------------------------------------------------------------------------------------------------------------------------------------------------------------------------------------------------------------------------------------------------------------------
2007 2006
--------------------------------------------------------------------------------------------------------------------------------------------------------------------------------------------------------------------------------------------------------------------------------------------------------
Within one year 1,708 1,228
1 to 2 years 1,220 1,711
2 to 3 years 3,759 2,772
3 to 4 years 365 117
4 to 5 years 1,650 –
5to10years 105 220
Over 10 years ––
--------------------------------------------------------------------------------------------------------------------------------------------------------------------------------------------------------------------------------------------------------------------------------------------------------
8,807 6,048
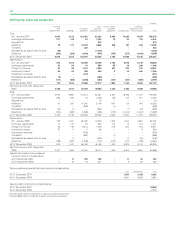
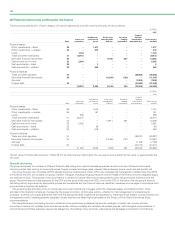
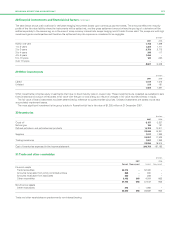
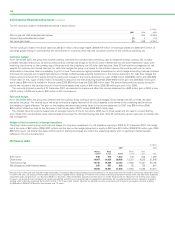
29 Other investments
$ million
--------------------------------------------------------------------------------------------------------------------------------------------------------------------------------------------------------------------------------------------------------------------------------------------------------
2007 2006
--------------------------------------------------------------------------------------------------------------------------------------------------------------------------------------------------------------------------------------------------------------------------------------------------------
Listed 1,617 1,516
Unlisted 213 181
--------------------------------------------------------------------------------------------------------------------------------------------------------------------------------------------------------------------------------------------------------------------------------------------------------
1,830 1,697
Other investments comprise equity investments that have no fixed maturity date or coupon rate. These investments are classified as available-for-sale
financial assets and as such are recorded at fair value with the gain or loss arising as a result of changes in fair value recorded directly in equity.
The fair value of listed investments has been determined by reference to quoted market bid prices. Unlisted investments are stated at cost less
accumulated impairment losses.
The most significant investment is the group’s stake in Rosneft which had a fair value of $1,285 million at 31 December 2007.
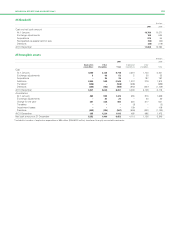
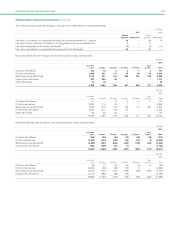
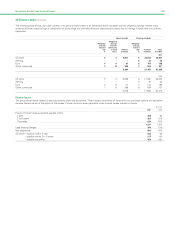
30 Inventories
$ million
--------------------------------------------------------------------------------------------------------------------------------------------------------------------------------------------------------------------------------------------------------------------------------------------------------
2007 2006
--------------------------------------------------------------------------------------------------------------------------------------------------------------------------------------------------------------------------------------------------------------------------------------------------------
Crude oil 8,157 5,357
Natural gas 160 127
Refined petroleum and petrochemical products 14,723 10,817
--------------------------------------------------------------------------------------------------------------------------------------------------------------------------------------------------------------------------------------------------------------------------------------------------------
23,040 16,301
Supplies 1,517 1,222
--------------------------------------------------------------------------------------------------------------------------------------------------------------------------------------------------------------------------------------------------------------------------------------------------------
24,557 17,523
Trading inventories 1,997 1,392
--------------------------------------------------------------------------------------------------------------------------------------------------------------------------------------------------------------------------------------------------------------------------------------------------------
26,554 18,915
Cost of inventories expensed in the income statement 200,766 187,183
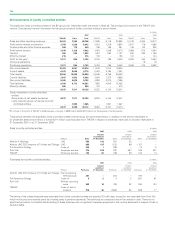
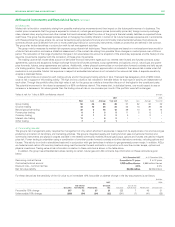
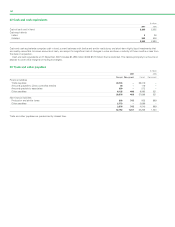
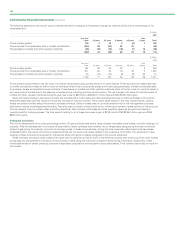
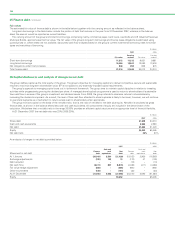
31 Trade and other receivables
$ million
--------------------------------------------------------------------------------------------------------------------------------------------------------------------------------------------------------------------------------------------------------------------------------------------------------
2007 2006
--------------------------------------------------------------------------------------------------------------------------------------------------------------------------------------------------------------------------------------------------------------------------------------------------------
Current Non-current Current Non-current
--------------------------------------------------------------------------------------------------------------------------------------------------------------------------------------------------------------------------------------------------------------------------------------------------------
Financial assets
Trade receivables 33,012 – 32,460 –
Amounts receivable from jointly controlled entities 888 – 830 –
Amounts receivable from associates 380 – 268 –
Other receivables 3,462 968 4,054 862
--------------------------------------------------------------------------------------------------------------------------------------------------------------------------------------------------------------------------------------------------------------------------------------------------------
37,742 968 37,612 862
--------------------------------------------------------------------------------------------------------------------------------------------------------------------------------------------------------------------------------------------------------------------------------------------------------
Non-financial assets
Other receivables 278 – 1,080 –
--------------------------------------------------------------------------------------------------------------------------------------------------------------------------------------------------------------------------------------------------------------------------------------------------------
38,020 968 38,692 862
Trade and other receivables are predominantly non-interest bearing.