BP 2007 Annual Report Download - page 154
Download and view the complete annual report
Please find page 154 of the 2007 BP annual report below. You can navigate through the pages in the report by either clicking on the pages listed below, or by using the keyword search tool below to find specific information within the annual report.-
 1
1 -
2
-
3
-
4
-
5
-
6
-
7
-
8
-
9
-
10
-
11
-
12
-
13
-
14
-
15
-
16
-
17
-
18
-
19
-
20
-
21
-
22
-
23
-
24
-
25
-
26
-
27
-
28
-
29
-
30
-
31
-
32
-
33
-
34
-
35
-
36
-
37
-
38
-
39
-
40
-
41
-
42
-
43
-
44
-
45
-
46
-
47
-
48
-
49
-
50
-
51
-
52
-
53
-
54
-
55
-
56
-
57
-
58
-
59
-
60
-
61
-
62
-
63
-
64
-
65
-
66
-
67
-
68
-
69
-
70
-
71
-
72
-
73
-
74
-
75
-
76
-
77
-
78
-
79
-
80
-
81
-
82
-
83
-
84
-
85
-
86
-
87
-
88
-
89
-
90
-
91
-
92
-
93
-
94
-
95
-
96
-
97
-
98
-
99
-
100
-
101
-
102
-
103
-
104
-
105
-
106
-
107
-
108
-
109
-
110
-
111
-
112
-
113
-
114
-
115
-
116
-
117
-
118
-
119
-
120
-
121
-
122
-
123
-
124
-
125
-
126
-
127
-
128
-
129
-
130
-
131
-
132
-
133
-
134
-
135
-
136
-
137
-
138
-
139
-
140
-
141
-
142
-
143
-
 144
144 -
 145
145 -
 146
146 -
 147
147 -
 148
148 -
 149
149 -
 150
150 -
 151
151 -
 152
152 -
 153
153 -
 154
154 -
 155
155 -
 156
156 -
 157
157 -
 158
158 -
 159
159 -
 160
160 -
 161
161 -
 162
162 -
 163
163 -
 164
164 -
165
-
166
-
167
-
168
-
169
-
170
-
171
-
172
-
173
-
174
-
175
-
176
-
177
-
178
-
179
-
180
-
181
-
182
-
183
-
184
-
185
-
186
-
187
-
188
-
189
-
190
-
191
-
192
-
193
-
194
-
195
-
196
-
197
-
198
-
199
-
200
-
201
-
202
-
203
-
204
-
205
-
206
-
207
-
208
-
209
-
210
-
211
-
212
 |
 |

152
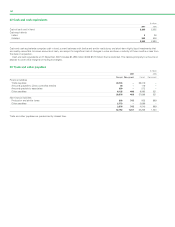
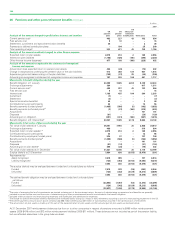
38 Pensions and other post-retirement benefits
Most group companies have pension plans, the forms and benefits of which vary with conditions and practices in the countries concerned. Pension
benefits may be provided through defined contribution plans (money purchase schemes) or defined benefit plans (final salary and other types of
schemes with committed pension payments). For defined contribution plans, retirement benefits are determined by the value of funds arising from
contributions paid in respect of each employee. For defined benefit plans, retirement benefits are based on such factors as the employees’
pensionable salary and length of service. Defined benefit plans may be externally funded or unfunded. The assets of funded plans are generally held in
separately administered trusts.
In particular, the primary pension arrangement in the UK is a funded final salary pension plan that remains open to new employees. Retired
employees draw the majority of their benefit as an annuity.
In the US, a range of retirement arrangements are provided. These include a funded final salary pension plan for certain heritage employees and a
cash balance arrangement for new hires. Retired US employees typically take their pension benefit in the form of a lump sum payment. US
employees are also eligible to participate in a defined contribution (401k) plan in which employee contributions are matched with company
contributions.
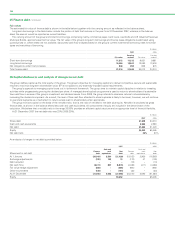
The level of contributions to funded defined benefit plans is the amount needed to provide adequate funds to meet pension obligations as they fall
due. During 2007, contributions of $524 million (2006 $438 million and 2005 $340 million) and $97 million (2006 $181 million and 2005 $279 million)
were made to the UK plans and US plans respectively. In addition, contributions of $127 million (2006 $136 million and 2005 $140 million) were made
to other funded defined benefit plans. The aggregate level of contributions in 2008 is expected to be approximately $500 million.
Certain group companies, principally in the US, provide post-retirement healthcare and life insurance benefits to their retired employees and
dependants. The entitlement to these benefits is usually based on the employee remaining in service until retirement age and completion of a
minimum period of service. The plans are funded to a limited extent.
The obligation and cost of providing pensions and other post-retirement benefits is assessed annually using the projected unit credit method. The
date of the most recent actuarial review was 31 December 2007.
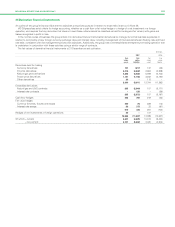
The material financial assumptions used for estimating the benefit obligations of the various plans are set out below. The assumptions used to
evaluate accrued pension and other post-retirement benefits at 31 December in any year are used to determine pension and other post-retirement
expense for the following year, that is, the assumptions at 31 December 2007 are used to determine the pension liabilities at that date and the
pension cost for 2008.
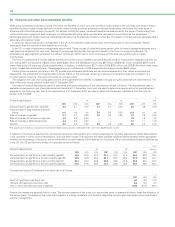
%
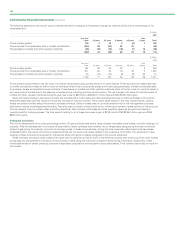
--------------------------------------------------------------------------------------------------------------------------------------------------------------------------------------------------------------------------------------------------------------------------------------------------------
Financial assumptions UK US Other
--------------------------------------------------------------------------------------------------------------------------------------------------------------------------------------------------------------------------------------------------------------------------------------------------------
2007 2006 2005 2007 2006 2005 2007 2006 2005
--------------------------------------------------------------------------------------------------------------------------------------------------------------------------------------------------------------------------------------------------------------------------------------------------------
Discount rate for pension plan liabilities 5.7 5.1 4.75 6.1 5.7 5.50 5.6 4.8 4.00
Discount rate for post-retirement benefit
plans n/a n/a n/a 6.4 5.9 5.50 n/a n/a n/a
Rate of increase in salariesa5.1 4.7 4.25 4.2 4.2 4.25 3.7 3.6 3.25
Rate of increase for pensions in payment 3.2 2.8 2.50 –––1.8 1.8 1.75
Rate of increase in deferred pensions 3.2 2.8 2.50 –––1.2 1.1 1.00
Inflation 3.2 2.8 2.50 2.4 2.4 2.50 2.2 2.2 2.00
aThis assumption includes an allowance for promotion-related salary growth, of between 0.3% and 0.4% depending on country.
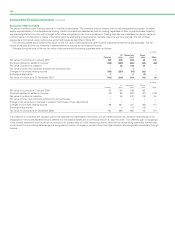
In addition to the financial assumptions, we regularly review the demographic and mortality assumptions. Mortality assumptions reflect best practice
in the countries in which we provide pensions, and have been chosen with regard to the latest available published tables adjusted where appropriate
to reflect the experience of the group and an extrapolation of past longevity improvements into the future. BP’s most substantial pension liabilities are
in the UK, the US and Germany where our assumptions are as follows:
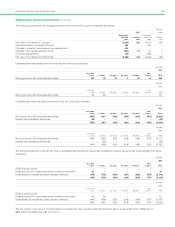
Years
--------------------------------------------------------------------------------------------------------------------------------------------------------------------------------------------------------------------------------------------------------------------------------------------------------
Mortality assumptions UK US Germany
--------------------------------------------------------------------------------------------------------------------------------------------------------------------------------------------------------------------------------------------------------------------------------------------------------
2007 2006 2005 2007 2006 2005 2007 2006 2005
--------------------------------------------------------------------------------------------------------------------------------------------------------------------------------------------------------------------------------------------------------------------------------------------------------
Life expectancy at age 60 for a male currently aged 60 24.0 23.9 23.0 24.3 24.2 21.9 22.4 22.2 22.1
Life expectancy at age 60 for a female currently aged 60 26.9 26.8 26.0 26.1 26.0 25.6 27.0 26.9 26.7
Life expectancy at age 60 for a male currently aged 40 25.1 25.0 23.9 25.8 25.8 21.9 25.3 25.2 25.0
Life expectancy at age 60 for a female currently aged 40 27.9 27.8 26.9 27.0 26.9 25.6 29.7 29.6 29.4
The assumed future US healthcare cost trend rate is as follows:
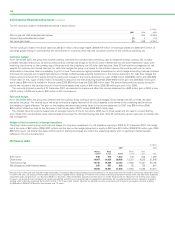
%
--------------------------------------------------------------------------------------------------------------------------------------------------------------------------------------------------------------------------------------------------------------------------------------------------------
2007 2006 2005
--------------------------------------------------------------------------------------------------------------------------------------------------------------------------------------------------------------------------------------------------------------------------------------------------------
Initial US healthcare cost trend rate 9.0 9.3 10.3
Ultimate US healthcare cost trend rate 5.0 5.0 5.0
Year in which ultimate trend rate is reached 2013 2013 2013
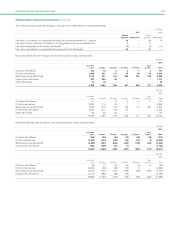
Pension plan assets are generally held in trusts. The primary objective of the trusts is to accumulate pools of assets sufficient to meet the obligation of
the various plans. The assets of the trusts are invested in a manner consistent with fiduciary obligations and principles that reflect current practicesin
portfolio management.