BP 2007 Annual Report Download - page 165
Download and view the complete annual report
Please find page 165 of the 2007 BP annual report below. You can navigate through the pages in the report by either clicking on the pages listed below, or by using the keyword search tool below to find specific information within the annual report.-
 1
1 -
2
-
3
-
4
-
5
-
6
-
7
-
8
-
9
-
10
-
11
-
12
-
13
-
14
-
15
-
16
-
17
-
18
-
19
-
20
-
21
-
22
-
23
-
24
-
25
-
26
-
27
-
28
-
29
-
30
-
31
-
32
-
33
-
34
-
35
-
36
-
37
-
38
-
39
-
40
-
41
-
42
-
43
-
44
-
45
-
46
-
47
-
48
-
49
-
50
-
51
-
52
-
53
-
54
-
55
-
56
-
57
-
58
-
59
-
60
-
61
-
62
-
63
-
64
-
65
-
66
-
67
-
68
-
69
-
70
-
71
-
72
-
73
-
74
-
75
-
76
-
77
-
78
-
79
-
80
-
81
-
82
-
83
-
84
-
85
-
86
-
87
-
88
-
89
-
90
-
91
-
92
-
93
-
94
-
95
-
96
-
97
-
98
-
99
-
100
-
101
-
102
-
103
-
104
-
105
-
106
-
107
-
108
-
109
-
110
-
111
-
112
-
113
-
114
-
115
-
116
-
117
-
118
-
119
-
120
-
121
-
122
-
123
-
124
-
125
-
126
-
127
-
128
-
129
-
130
-
131
-
132
-
133
-
134
-
135
-
136
-
137
-
138
-
139
-
140
-
141
-
142
-
143
-
144
-
145
-
146
-
147
-
148
-
149
-
150
-
151
-
152
-
153
-
154
-
 155
155 -
 156
156 -
 157
157 -
 158
158 -
 159
159 -
 160
160 -
 161
161 -
 162
162 -
 163
163 -
 164
164 -
 165
165 -
 166
166 -
 167
167 -
 168
168 -
 169
169 -
 170
170 -
 171
171 -
 172
172 -
 173
173 -
 174
174 -
 175
175 -
176
-
177
-
178
-
179
-
180
-
181
-
182
-
183
-
184
-
185
-
186
-
187
-
188
-
189
-
190
-
191
-
192
-
193
-
194
-
195
-
196
-
197
-
198
-
199
-
200
-
201
-
202
-
203
-
204
-
205
-
206
-
207
-
208
-
209
-
210
-
211
-
212
 |
 |

BP ANNUAL REPORT AND ACCOUNTS 2007 163
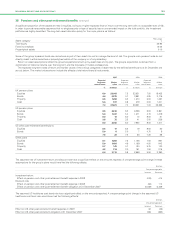
41 Share-based payments continued
Fair values and associated details for options and shares granted
--------------------------------------------------------------------------------------------------------------------------------------------------------------------------------------------------------------------------------------------------------------------------------------------------------
Options granted in 2007 ShareSave 3 year ShareSave 5 year
--------------------------------------------------------------------------------------------------------------------------------------------------------------------------------------------------------------------------------------------------------------------------------------------------------
Option pricing model used Binomial Binomial
Weighted average fair value $3.57 $3.79
Weighted average share price $12.10 $12.10
Weighted average exercise price $9.13 $9.13
Expected volatility 21% 21%
Option life 3.5 years 5.5 years
Expected dividends 3.48% 3.48%
Risk free interest rate 5.75% 5.75%
Expected exercise behaviour 100% year 4 100% year 6
--------------------------------------------------------------------------------------------------------------------------------------------------------------------------------------------------------------------------------------------------------------------------------------------------------
Options granted in 2006 BPSOP ShareSave 3 year ShareSave 5 year
--------------------------------------------------------------------------------------------------------------------------------------------------------------------------------------------------------------------------------------------------------------------------------------------------------
Option pricing model used Binomial Binomial Binomial
Weighted average fair value $2.46 $2.88 $3.08
Weighted average share price $11.07 $11.08 $11.08
Weighted average exercise price $11.17 $9.10 $9.10
Expected volatility 22% 24% 24%
Option life 10 years 3.5 years 5.5 years
Expected dividends 3.23% 3.40% 3.40%
Risk free interest rate 4.50% 5.00% 4.75%
Expected exercise behaviour 5% years 4-9, 100% year 4 100% year 6
70% year 10
--------------------------------------------------------------------------------------------------------------------------------------------------------------------------------------------------------------------------------------------------------------------------------------------------------
Options granted in 2005 BPSOP ShareSave 3 year ShareSave 5 year
--------------------------------------------------------------------------------------------------------------------------------------------------------------------------------------------------------------------------------------------------------------------------------------------------------
Option pricing model used Binomial Binomial Binomial
Weighted average fair value $2.34 $2.76 $2.94
Weighted average share price $10.85 $10.49 $10.49
Weighted average exercise price $10.63 $7.96 $7.96
Expected volatility 18% 18% 18%
Option life 10 years 3.5 years 5.5 years
Expected dividends 2.72% 3.00% 3.00%
Risk free interest rate 4.25% 4.00% 4.25%
Expected exercise behaviour 5% years 4-9, 100% year 4 100% year 6
70% year 10
The group uses an appropriate valuation model of expected volatility of US ADSs for the quarter within which the grant date of the relevant plan falls.
Management is responsible for all inputs and assumptions in relation to that model, including the determination of expected volatility.
--------------------------------------------------------------------------------------------------------------------------------------------------------------------------------------------------------------------------------------------------------------------------------------------------------
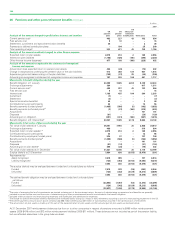
MTPP- MTPP- EDIP- EDIP-
Shares granted in 2007 TSR FCF TSR LTL RSP DAB PSP
--------------------------------------------------------------------------------------------------------------------------------------------------------------------------------------------------------------------------------------------------------------------------------------------------------
Number of equity instruments
granted (million) 9.4 8.5 4.5 0.5 7.7 4.4 14.8
Weighted average fair value $4.73 $10.02 $2.81 $9.92 $11.93 $10.02 $12.37
Fair value measurement basis Monte Carlo Market value Monte Carlo Market value Market value Market value Monte Carlo
--------------------------------------------------------------------------------------------------------------------------------------------------------------------------------------------------------------------------------------------------------------------------------------------------------
MTPP- MTPP- EDIP- EDIP-
Shares granted in 2006 TSR FCF TSR LTL RSP DAB
--------------------------------------------------------------------------------------------------------------------------------------------------------------------------------------------------------------------------------------------------------------------------------------------------------
Number of equity instruments granted (million) 8.7 7.8 3.3 0.5 0.5 3.5
Weighted average fair value $7.28 $11.23 $4.87 $11.23 $11.07 $11.06
Fair value measurement basis Monte Carlo Market value Monte Carlo Market value Market value Market value
--------------------------------------------------------------------------------------------------------------------------------------------------------------------------------------------------------------------------------------------------------------------------------------------------------
MTPP- MTPP- EDIP- EDIP-
Shares granted in 2005 TSR FCF TSR LTL RSP
--------------------------------------------------------------------------------------------------------------------------------------------------------------------------------------------------------------------------------------------------------------------------------------------------------
Number of equity instruments granted (million) 9.3 8.4 3.7 0.5 0.3
Weighted average fair value $5.72 $11.04 $3.87 $10.13 $11.04
Fair value measurement basis Monte Carlo Market value Monte Carlo Market value Market value
The group used a Monte Carlo simulation to fair value the TSR element of the 2007, 2006 and 2005 PSP, MTPP and EDIP plans. In accordance with
the rules of the plans the model simulates BP’s TSR and compares it against our principal strategic competitors over the three-year period of the
plans. The model takes into account the historic dividends, share price volatilities and covariances of BP and each comparator company to produce a
predicted distribution of relative share performance. This is applied to the reward criteria to give an expected value of the TSR element.
Accounting expense does not necessarily represent the actual value of share-based payments made to recipients, which are determined by the
remuneration committee according to established criteria.