BP 2007 Annual Report Download - page 142
Download and view the complete annual report
Please find page 142 of the 2007 BP annual report below. You can navigate through the pages in the report by either clicking on the pages listed below, or by using the keyword search tool below to find specific information within the annual report.-
 1
1 -
2
-
3
-
4
-
5
-
6
-
7
-
8
-
9
-
10
-
11
-
12
-
13
-
14
-
15
-
16
-
17
-
18
-
19
-
20
-
21
-
22
-
23
-
24
-
25
-
26
-
27
-
28
-
29
-
30
-
31
-
32
-
33
-
34
-
35
-
36
-
37
-
38
-
39
-
40
-
41
-
42
-
43
-
44
-
45
-
46
-
47
-
48
-
49
-
50
-
51
-
52
-
53
-
54
-
55
-
56
-
57
-
58
-
59
-
60
-
61
-
62
-
63
-
64
-
65
-
66
-
67
-
68
-
69
-
70
-
71
-
72
-
73
-
74
-
75
-
76
-
77
-
78
-
79
-
80
-
81
-
82
-
83
-
84
-
85
-
86
-
87
-
88
-
89
-
90
-
91
-
92
-
93
-
94
-
95
-
96
-
97
-
98
-
99
-
100
-
101
-
102
-
103
-
104
-
105
-
106
-
107
-
108
-
109
-
110
-
111
-
112
-
113
-
114
-
115
-
116
-
117
-
118
-
119
-
120
-
121
-
122
-
123
-
124
-
125
-
126
-
127
-
128
-
129
-
130
-
131
-
 132
132 -
 133
133 -
 134
134 -
 135
135 -
 136
136 -
 137
137 -
 138
138 -
 139
139 -
 140
140 -
 141
141 -
 142
142 -
 143
143 -
 144
144 -
 145
145 -
 146
146 -
 147
147 -
 148
148 -
 149
149 -
 150
150 -
 151
151 -
 152
152 -
153
-
154
-
155
-
156
-
157
-
158
-
159
-
160
-
161
-
162
-
163
-
164
-
165
-
166
-
167
-
168
-
169
-
170
-
171
-
172
-
173
-
174
-
175
-
176
-
177
-
178
-
179
-
180
-
181
-
182
-
183
-
184
-
185
-
186
-
187
-
188
-
189
-
190
-
191
-
192
-
193
-
194
-
195
-
196
-
197
-
198
-
199
-
200
-
201
-
202
-
203
-
204
-
205
-
206
-
207
-
208
-
209
-
210
-
211
-
212
 |
 |

140
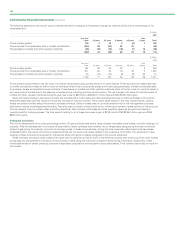
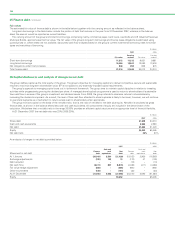
28 Financial instruments and financial risk factors continued
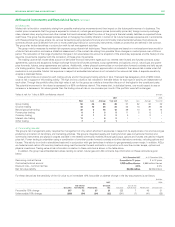
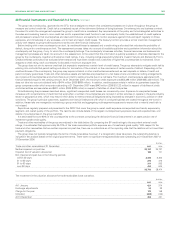
(c) Liquidity risk
Liquidity risk is the risk that suitable sources of funding for the group’s business activities may not be available. The group’s liquidity is managed
centrally with operating units forecasting their cash and currency requirements to the central treasury function. Unless restricted by local regulations,
subsidiaries pool their cash surpluses to treasury, which will then arrange to fund other subsidiaries’ requirements, or invest any net surplus in the
market or arrange for necessary external borrowings, while managing the group’s overall net currency positions.
In managing its liquidity risk, the group has access to a wide range of funding at competitive rates through capital markets and banks. The group’s
treasury function centrally co-ordinates relationships with banks, borrowing requirements, foreign exchange requirements and cash management. The
group believes it has access to sufficient funding through the commercial paper markets and by using undrawn committed borrowing facilities to meet
foreseeable borrowing requirements. At, 31 December 2007, the group had substantial amounts of undrawn borrowing facilities available, including
committed facilities of $4,950 million, of which $4,550 million are in place for at least four years (2006 $4,700 million of which $4,300 million are in
place for at least five years). These facilities are with a number of international banks and borrowings under them would be at pre-agreed rates.
The group has in place a European Debt Issuance Programme (DIP) under which the group may raise $15 billion of debt for maturities of one month
or longer. At 31 December 2007, the amount drawn down against the DIP was $10,438 million (2006 $7,893 million). In addition, the group has in
place a US Shelf Registration under which it may raise $10 billion of debt with maturities of one month or longer. At 31 December 2007, the amount
drawn down under the US Shelf was $2,500 million (2006 nil).
The group has long-term debt ratings of Aa1 (stable outlook) and AA+ (negative outlook), assigned respectively by Moody’s and Standard and
Poor’s.
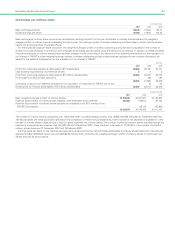
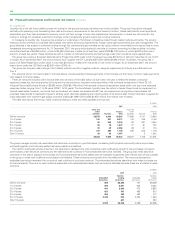
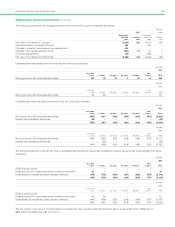
The amounts shown for finance debt in the table below include expected interest payments on borrowings and the future minimum lease payments
with respect to finance leases.
There are amounts included within finance debt that we show in the table below as due within one year to reflect the earliest contractual
repayment dates but that are expected to be repaid over the maximum long-term maturity profiles of the contracts as described in Note 35. US
Industrial Revenue/Municipal Bonds of $2,880 million (2006 $2,744 million) with earliest contractual repayment dates within one year have expected
repayment dates ranging from 1 to 35 years (2006 1 to 34 years). The bondholders typically have the option to tender these bonds for repayment on
interest reset dates; however, any bonds that are tendered are usually remarketed and BP has not experienced any significant repurchases. BP
considers these bonds to represent long-term funding when internally assessing the maturity profile of its finance debt. Similar treatment is applied for
loans associated with long-term gas supply contracts totalling $1,899 million (2006 $1,976 million) that mature over 10 years.
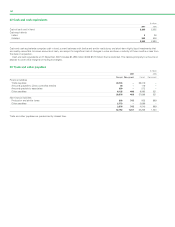
The table also shows the timing of cash outflows relating to trade and other payables and accruals.
$ million
--------------------------------------------------------------------------------------------------------------------------------------------------------------------------------------------------------------------------------------------------------------------------------------------------------
2007 2006
--------------------------------------------------------------------------------------------------------------------------------------------------------------------------------------------------------------------------------------------------------------------------------------------------------
Trade and Trade and
other Finance other Finance
payables Accruals debt payables Accruals debt
--------------------------------------------------------------------------------------------------------------------------------------------------------------------------------------------------------------------------------------------------------------------------------------------------------
Within one year 39,576 6,640 16,561 37,696 6,147 13,864
1 to 2 years 147 351 8,011 100 349 4,146
2 to 3 years 62 245 3,515 80 227 4,354
3 to 4 years 26 78 1,447 57 81 723
4 to 5 years 30 49 2,352 68 61 776
5to10years 197 200 1,100 226 240 1,778
Over 10 years 24 36 1,447 – 3 1,650
--------------------------------------------------------------------------------------------------------------------------------------------------------------------------------------------------------------------------------------------------------------------------------------------------------
40,062 7,599 34,433 38,227 7,108 27,291
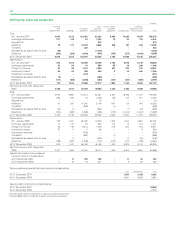
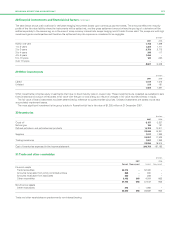
The group manages liquidity risk associated with derivative contracts on a portfolio basis, considering both physical commodity sale and purchase
contracts together with financially-settled derivative assets and liabilities.
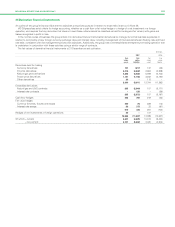
The held-for-trading derivatives amounts in the table below represent the total contractual cash outflows by period for the purchases of physical
commodities under derivative contracts and the estimated cash outflows of financially-settled derivative liabilities. The group also holds derivative
contracts for the sale of physical commodities and financially-settled derivative assets that are expected to generate cash inflows that will be available
to the group to meet cash outflows on purchases and liabilities. These contracts are excluded from the table below. The amounts disclosed for
embedded derivatives represent the contractual cash outflows of purchase contracts. The embedded derivatives associated with these contracts are
all financial assets. There are no cash outflows associated with embedded derivatives that are financial liabilities because these are all related to sales
contracts.
$ million
--------------------------------------------------------------------------------------------------------------------------------------------------------------------------------------------------------------------------------------------------------------------------------------------------------
2007 2006
--------------------------------------------------------------------------------------------------------------------------------------------------------------------------------------------------------------------------------------------------------------------------------------------------------
Held-for- Held-for-
Embedded trading Embedded trading
derivatives derivatives derivatives derivatives
--------------------------------------------------------------------------------------------------------------------------------------------------------------------------------------------------------------------------------------------------------------------------------------------------------
Within one year 699 82,465 707 68,369
1 to 2 years 659 8,541 602 8,535
2 to 3 years 641 2,906 472 2,852
3 to 4 years 627 707 483 913
4 to 5 years 624 338 490 413
5to10years 2,342 592 2,335 1,626
Over 10 years – 447 –2
--------------------------------------------------------------------------------------------------------------------------------------------------------------------------------------------------------------------------------------------------------------------------------------------------------
5,592 95,996 5,089 82,988
80