BP 2007 Annual Report Download - page 166
Download and view the complete annual report
Please find page 166 of the 2007 BP annual report below. You can navigate through the pages in the report by either clicking on the pages listed below, or by using the keyword search tool below to find specific information within the annual report.-
 1
1 -
2
-
3
-
4
-
5
-
6
-
7
-
8
-
9
-
10
-
11
-
12
-
13
-
14
-
15
-
16
-
17
-
18
-
19
-
20
-
21
-
22
-
23
-
24
-
25
-
26
-
27
-
28
-
29
-
30
-
31
-
32
-
33
-
34
-
35
-
36
-
37
-
38
-
39
-
40
-
41
-
42
-
43
-
44
-
45
-
46
-
47
-
48
-
49
-
50
-
51
-
52
-
53
-
54
-
55
-
56
-
57
-
58
-
59
-
60
-
61
-
62
-
63
-
64
-
65
-
66
-
67
-
68
-
69
-
70
-
71
-
72
-
73
-
74
-
75
-
76
-
77
-
78
-
79
-
80
-
81
-
82
-
83
-
84
-
85
-
86
-
87
-
88
-
89
-
90
-
91
-
92
-
93
-
94
-
95
-
96
-
97
-
98
-
99
-
100
-
101
-
102
-
103
-
104
-
105
-
106
-
107
-
108
-
109
-
110
-
111
-
112
-
113
-
114
-
115
-
116
-
117
-
118
-
119
-
120
-
121
-
122
-
123
-
124
-
125
-
126
-
127
-
128
-
129
-
130
-
131
-
132
-
133
-
134
-
135
-
136
-
137
-
138
-
139
-
140
-
141
-
142
-
143
-
144
-
145
-
146
-
147
-
148
-
149
-
150
-
151
-
152
-
153
-
154
-
155
-
 156
156 -
 157
157 -
 158
158 -
 159
159 -
 160
160 -
 161
161 -
 162
162 -
 163
163 -
 164
164 -
 165
165 -
 166
166 -
 167
167 -
 168
168 -
 169
169 -
 170
170 -
 171
171 -
 172
172 -
 173
173 -
 174
174 -
 175
175 -
 176
176 -
177
-
178
-
179
-
180
-
181
-
182
-
183
-
184
-
185
-
186
-
187
-
188
-
189
-
190
-
191
-
192
-
193
-
194
-
195
-
196
-
197
-
198
-
199
-
200
-
201
-
202
-
203
-
204
-
205
-
206
-
207
-
208
-
209
-
210
-
211
-
212
 |
 |

164
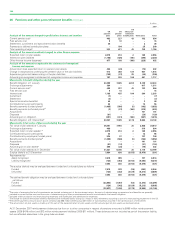
42 Employee costs and numbers
$ million
--------------------------------------------------------------------------------------------------------------------------------------------------------------------------------------------------------------------------------------------------------------------------------------------------------
Employee costs 2007 2006 2005
--------------------------------------------------------------------------------------------------------------------------------------------------------------------------------------------------------------------------------------------------------------------------------------------------------
Wages and salariesa9,560 8,411 8,695
Social security costs 771 751 754
Share-based payments 428 419 368
Pension and other post-retirement benefit costs 504 770 929
--------------------------------------------------------------------------------------------------------------------------------------------------------------------------------------------------------------------------------------------------------------------------------------------------------
11,263 10,351 10,746
Innovene operations –– (892)
--------------------------------------------------------------------------------------------------------------------------------------------------------------------------------------------------------------------------------------------------------------------------------------------------------
Continuing operations 11,263 10,351 9,854
--------------------------------------------------------------------------------------------------------------------------------------------------------------------------------------------------------------------------------------------------------------------------------------------------------
Number of employees at 31 December 2007 2006 2005
--------------------------------------------------------------------------------------------------------------------------------------------------------------------------------------------------------------------------------------------------------------------------------------------------------
Exploration and Production 19,800 19,000 17,000
Refining and Marketingb69,000 69,500 70,800
Gas, Power and Renewables 4,500 4,500 4,100
Other businesses and corporate 4,300 4,000 4,300
--------------------------------------------------------------------------------------------------------------------------------------------------------------------------------------------------------------------------------------------------------------------------------------------------------
97,600 97,000 96,200
By geographical area
--------------------------------------------------------------------------------------------------------------------------------------------------------------------------------------------------------------------------------------------------------------------------------------------------------
UK 17,000 16,900 16,500
Rest of Europe 19,900 20,200 21,300
US 33,000 33,700 34,400
Rest of World 27,700 26,200 24,000
--------------------------------------------------------------------------------------------------------------------------------------------------------------------------------------------------------------------------------------------------------------------------------------------------------
97,600 97,000 96,200
--------------------------------------------------------------------------------------------------------------------------------------------------------------------------------------------------------------------------------------------------------------------------------------------------------
2007 2006
--------------------------------------------------------------------------------------------------------------------------------------------------------------------------------------------------------------------------------------------------------------------------------------------------------
Rest of Rest of Rest of Rest of
Average number of employees UK Europe US World Total UK Europe US World Total
--------------------------------------------------------------------------------------------------------------------------------------------------------------------------------------------------------------------------------------------------------------------------------------------------------
Exploration and Production 3,700 700 6,600 8,700 19,700 3,300 700 6,100 8,100 18,200
Refining and Marketing 10,600 18,600 23,500 16,300 69,000 11,300 19,300 24,900 15,000 70,500
Gas, Power and Renewables 300 700 1,800 1,500 4,300 300 700 1,600 1,700 4,300
Other businesses and corporate 2,100 200 1,700 200 4,200 1,900 200 1,900 100 4,100
--------------------------------------------------------------------------------------------------------------------------------------------------------------------------------------------------------------------------------------------------------------------------------------------------------
16,700 20,200 33,600 26,700 97,200 16,800 20,900 34,500 24,900 97,100
--------------------------------------------------------------------------------------------------------------------------------------------------------------------------------------------------------------------------------------------------------------------------------------------------------
2005
--------------------------------------------------------------------------------------------------------------------------------------------------------------------------------------------------------------------------------------------------------------------------------------------------------
Rest of Rest of
Average number of employees UK Europe US World Total
--------------------------------------------------------------------------------------------------------------------------------------------------------------------------------------------------------------------------------------------------------------------------------------------------------
Exploration and Production 3,000 600 5,300 7,300 16,200
Refining and Marketing 11,100 19,700 26,200 14,000 71,000
Gas, Power and Renewables 200 800 1,500 1,400 3,900
Other businesses and corporate 3,800 3,900 3,600 300 11,600
--------------------------------------------------------------------------------------------------------------------------------------------------------------------------------------------------------------------------------------------------------------------------------------------------------
18,100 25,000 36,600 23,000 102,700
aIncludes termination payments of $422 million (2006 $257 million and 2005 $348 million). A restructuring was announced in October 2007, the implementation of which is
expected to continue through 2008 and into 2009. Additional restructuring charges to the income statement of around $1 billion are expected in 2008.
bIncludes 25,900 (2006 26,100 and 2005 27,800) service station staff.
43 Remuneration of directors and senior management
Remuneration of directors $ million
--------------------------------------------------------------------------------------------------------------------------------------------------------------------------------------------------------------------------------------------------------------------------------------------------------
2007 2006 2005
--------------------------------------------------------------------------------------------------------------------------------------------------------------------------------------------------------------------------------------------------------------------------------------------------------
Total for all directors
Emoluments 26 14 18
Gains made on the exercise of share options 212 –
Amounts awarded under incentive schemes 10 14 8
Emoluments
These amounts comprise fees paid to the non-executive chairman and the non-executive directors and, for executive directors, salary and benefits
earned during the relevant financial year, plus bonuses awarded for the year. This includes an ex gratia superannuation payment of $3 million (2006
and 2005 nil) and compensation for loss of office of $1 million (2006 and 2005 nil).
Pension contributions
Six executive directors participated in a non-contributory pension scheme established for UK employees by a separate trust fund to which
contributions are made by BP based on actuarial advice. One US executive director participated in the US BP Retirement Accumulation Plan
during 2007.