BP 2007 Annual Report Download - page 118
Download and view the complete annual report
Please find page 118 of the 2007 BP annual report below. You can navigate through the pages in the report by either clicking on the pages listed below, or by using the keyword search tool below to find specific information within the annual report.-
 1
1 -
2
-
3
-
4
-
5
-
6
-
7
-
8
-
9
-
10
-
11
-
12
-
13
-
14
-
15
-
16
-
17
-
18
-
19
-
20
-
21
-
22
-
23
-
24
-
25
-
26
-
27
-
28
-
29
-
30
-
31
-
32
-
33
-
34
-
35
-
36
-
37
-
38
-
39
-
40
-
41
-
42
-
43
-
44
-
45
-
46
-
47
-
48
-
49
-
50
-
51
-
52
-
53
-
54
-
55
-
56
-
57
-
58
-
59
-
60
-
61
-
62
-
63
-
64
-
65
-
66
-
67
-
68
-
69
-
70
-
71
-
72
-
73
-
74
-
75
-
76
-
77
-
78
-
79
-
80
-
81
-
82
-
83
-
84
-
85
-
86
-
87
-
88
-
89
-
90
-
91
-
92
-
93
-
94
-
95
-
96
-
97
-
98
-
99
-
100
-
101
-
102
-
103
-
104
-
105
-
106
-
107
-
 108
108 -
 109
109 -
 110
110 -
 111
111 -
 112
112 -
 113
113 -
 114
114 -
 115
115 -
 116
116 -
 117
117 -
 118
118 -
 119
119 -
 120
120 -
 121
121 -
 122
122 -
 123
123 -
 124
124 -
 125
125 -
 126
126 -
 127
127 -
 128
128 -
129
-
130
-
131
-
132
-
133
-
134
-
135
-
136
-
137
-
138
-
139
-
140
-
141
-
142
-
143
-
144
-
145
-
146
-
147
-
148
-
149
-
150
-
151
-
152
-
153
-
154
-
155
-
156
-
157
-
158
-
159
-
160
-
161
-
162
-
163
-
164
-
165
-
166
-
167
-
168
-
169
-
170
-
171
-
172
-
173
-
174
-
175
-
176
-
177
-
178
-
179
-
180
-
181
-
182
-
183
-
184
-
185
-
186
-
187
-
188
-
189
-
190
-
191
-
192
-
193
-
194
-
195
-
196
-
197
-
198
-
199
-
200
-
201
-
202
-
203
-
204
-
205
-
206
-
207
-
208
-
209
-
210
-
211
-
212
 |
 |

116
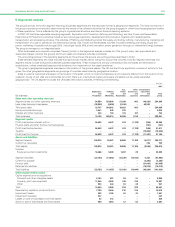
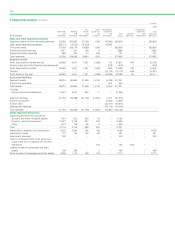
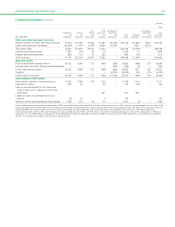
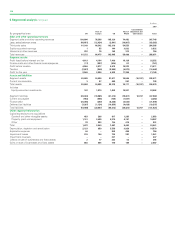
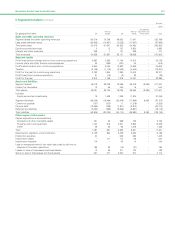
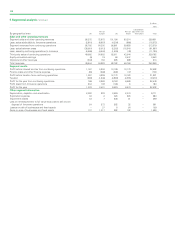
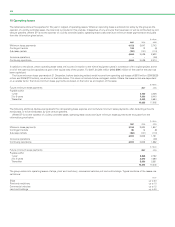
5 Segmental analysis continued
$ million
--------------------------------------------------------------------------------------------------------------------------------------------------------------------------------------------------------------------------------------------------------------------------------------------------------
2007
--------------------------------------------------------------------------------------------------------------------------------------------------------------------------------------------------------------------------------------------------------------------------------------------------------
Consolidation
Rest of Rest of adjustment and
By geographical area UK Europe US World eliminations Total
--------------------------------------------------------------------------------------------------------------------------------------------------------------------------------------------------------------------------------------------------------------------------------------------------------
Sales and other operating revenues
Segment sales and other operating revenues 109,800 78,366 105,120 74,462 – 367,748
Less: sales between areas (48,651) (12,024) (2,801) (19,907) – (83,383)
--------------------------------------------------------------------------------------------------------------------------------------------------------------------------------------------------------------------------------------------------------------------------------------------------------
Third party sales 61,149 66,342 102,319 54,555 – 284,365
Equity-accounted earnings 1 55 144 3,632 – 3,832
Interest and other revenues 222 78 142 312 – 754
--------------------------------------------------------------------------------------------------------------------------------------------------------------------------------------------------------------------------------------------------------------------------------------------------------
Total revenues 61,372 66,475 102,605 58,499 – 288,951
Segment results
Profit (loss) before interest and tax 4,613 4,164 7,439 16,136 – 32,352
Finance costs and other finance income/expense (17) (287) (524) 87 – (741)
--------------------------------------------------------------------------------------------------------------------------------------------------------------------------------------------------------------------------------------------------------------------------------------------------------
Profit before taxation 4,596 3,877 6,915 16,223 – 31,611
Taxation (2,027) (949) (2,593) (4,873) – (10,442)
--------------------------------------------------------------------------------------------------------------------------------------------------------------------------------------------------------------------------------------------------------------------------------------------------------
Profit for the year 2,569 2,928 4,322 11,350 – 21,169
Assets and liabilities
Segment assets 53,065 34,658 81,911 76,504 (10,767) 235,371
Current tax receivable 3 27 468 207 – 705
--------------------------------------------------------------------------------------------------------------------------------------------------------------------------------------------------------------------------------------------------------------------------------------------------------
Total assets 53,068 34,685 82,379 76,711 (10,767) 236,076
--------------------------------------------------------------------------------------------------------------------------------------------------------------------------------------------------------------------------------------------------------------------------------------------------------
Includes
Equity-accounted investments 142 1,970 1,659 18,921 – 22,692
Segment liabilities (30,043) (18,985) (31,314) (18,307) 10,767 (87,882)
Current tax payable (963) (658) (104) (1,557) – (3,282)
Finance debt (20,085) (200) (8,238) (2,522) – (31,045)
Deferred tax liabilities (3,397) (1,124) (10,656) (4,038) – (19,215)
--------------------------------------------------------------------------------------------------------------------------------------------------------------------------------------------------------------------------------------------------------------------------------------------------------
Total liabilities (54,488) (20,967) (50,312) (26,424) 10,767 (141,424)
Other segment information
Capital expenditure and acquisitions
Goodwill and other intangible assets 453 298 817 1,285 – 2,853
Property, plant and equipment 1,141 2,489 6,516 6,741 – 16,887
Other 78 253 154 416 – 901
--------------------------------------------------------------------------------------------------------------------------------------------------------------------------------------------------------------------------------------------------------------------------------------------------------
Total 1,672 3,040 7,487 8,442 – 20,641
--------------------------------------------------------------------------------------------------------------------------------------------------------------------------------------------------------------------------------------------------------------------------------------------------------
Depreciation, depletion and amortization 2,133 959 3,558 3,929 – 10,579
Exploration expense 46 – 252 458 – 756
Impairment losses 315 136 723 387 – 1,561
Impairment reversals – – 237 – – 237
Losses on sale of businesses and fixed assets 2 77 233 43 – 355
Gains on sale of businesses and fixed assets 893 655 770 169 – 2,487