BP 2007 Annual Report Download - page 54
Download and view the complete annual report
Please find page 54 of the 2007 BP annual report below. You can navigate through the pages in the report by either clicking on the pages listed below, or by using the keyword search tool below to find specific information within the annual report.-
 1
1 -
2
-
3
-
4
-
5
-
6
-
7
-
8
-
9
-
10
-
11
-
12
-
13
-
14
-
15
-
16
-
17
-
18
-
19
-
20
-
21
-
22
-
23
-
24
-
25
-
26
-
27
-
28
-
29
-
30
-
31
-
32
-
33
-
34
-
35
-
36
-
37
-
38
-
39
-
40
-
41
-
42
-
43
-
 44
44 -
 45
45 -
 46
46 -
 47
47 -
 48
48 -
 49
49 -
 50
50 -
 51
51 -
 52
52 -
 53
53 -
 54
54 -
 55
55 -
 56
56 -
 57
57 -
 58
58 -
 59
59 -
 60
60 -
 61
61 -
 62
62 -
 63
63 -
 64
64 -
65
-
66
-
67
-
68
-
69
-
70
-
71
-
72
-
73
-
74
-
75
-
76
-
77
-
78
-
79
-
80
-
81
-
82
-
83
-
84
-
85
-
86
-
87
-
88
-
89
-
90
-
91
-
92
-
93
-
94
-
95
-
96
-
97
-
98
-
99
-
100
-
101
-
102
-
103
-
104
-
105
-
106
-
107
-
108
-
109
-
110
-
111
-
112
-
113
-
114
-
115
-
116
-
117
-
118
-
119
-
120
-
121
-
122
-
123
-
124
-
125
-
126
-
127
-
128
-
129
-
130
-
131
-
132
-
133
-
134
-
135
-
136
-
137
-
138
-
139
-
140
-
141
-
142
-
143
-
144
-
145
-
146
-
147
-
148
-
149
-
150
-
151
-
152
-
153
-
154
-
155
-
156
-
157
-
158
-
159
-
160
-
161
-
162
-
163
-
164
-
165
-
166
-
167
-
168
-
169
-
170
-
171
-
172
-
173
-
174
-
175
-
176
-
177
-
178
-
179
-
180
-
181
-
182
-
183
-
184
-
185
-
186
-
187
-
188
-
189
-
190
-
191
-
192
-
193
-
194
-
195
-
196
-
197
-
198
-
199
-
200
-
201
-
202
-
203
-
204
-
205
-
206
-
207
-
208
-
209
-
210
-
211
-
212
 |
 |

52
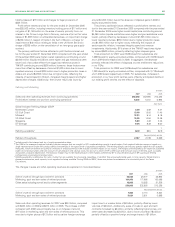
Non-GAAP information on fair value accounting effects forward prices consistent with the contract maturity. Depending on
BP uses derivative instruments to manage the economic exposure market conditions, these forward prices can be either higher or lower
relating to inventories above normal operating requirements of crude oil, than spot prices resulting in measurement differences.
natural gas and petroleum products as well as certain contracts to supply The Gas, Power and Renewables business enters into contracts for
physical volumes at future dates. Under IFRS, these inventories and pipelines and storage capacity that, under IFRS, are recorded on an
contracts are recorded at historic cost and on an accruals basis accruals basis. These contracts are risk managed using a variety of
respectively. The related derivative instruments, however, are required to derivative instruments that are fair valued under IFRS. This results in
be recorded at fair value with gains and losses recognized in income measurement differences in relation to recognition of gains and losses.
because hedge accounting is either not permitted or not followed, The way that BP manages the economic exposures described above,
principally due to the impracticality of effectiveness testing requirements. and measures performance internally, differs from the way these
Therefore, measurement differences in relation to recognition of gains activities are measured under IFRS. BP calculates this difference by
and losses occur. Gains and losses on these inventories and contracts comparing the IFRS result with management’s internal measure of
are not recognized until the commodity is sold in a subsequent performance, under which the inventory and the supply and capacity
accounting period. Gains and losses on the related derivative commodity contracts in question are valued based on fair value using relevant
contracts are recognized in the income statement from the time the forward prices prevailing at the end of the period. We believe that
derivative commodity contract is entered into on a fair value basis using disclosing management’s estimate of this difference provides useful
forward prices consistent with the contract maturity. information for investors because it enables investors to see the
IFRS requires that inventory held for trading be recorded at its fair economic effect of these activities as a whole. The impacts of
value using period end spot prices whereas any related derivative fair value accounting effects, relative to management’s internal measure
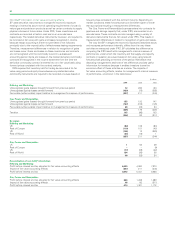
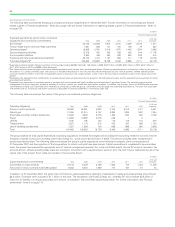
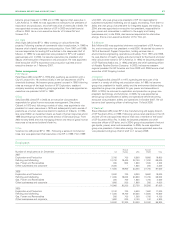
commodity instruments are required to be recorded at values based on of performance, are shown in the table below.
$ million
--------------------------------------------------------------------------------------------------------------------------------------------------------------------------------------------------------------------------------------------------------------------------------------------------------
2007 2006 2005
--------------------------------------------------------------------------------------------------------------------------------------------------------------------------------------------------------------------------------------------------------------------------------------------------------
Refining and Marketing
Unrecognized gains (losses) brought forward from previous period 72 283 (61)
Unrecognized (gains) losses carried forward (429) (72) (283)
--------------------------------------------------------------------------------------------------------------------------------------------------------------------------------------------------------------------------------------------------------------------------------------------------------
Favourable (unfavourable) impact relative to management’s measure of performance (357) 211 (344)
Gas, Power and Renewables
Unrecognized gains (losses) brought forward from previous period 155 123 147
Unrecognized (gains) losses carried forward (107) (155) (123)
--------------------------------------------------------------------------------------------------------------------------------------------------------------------------------------------------------------------------------------------------------------------------------------------------------
Favourable (unfavourable) impact relative to management’s measure of performance 48 (32) 24
(309) 179 (320)
Taxation 105 (96) 103
--------------------------------------------------------------------------------------------------------------------------------------------------------------------------------------------------------------------------------------------------------------------------------------------------------
(204) 83 (217)
By region
Refining and Marketing
UK (52) 109 (80)
Rest of Europe (110) 101 (45)
US (165) 13 (220)
Rest of World (30) (12) 1
--------------------------------------------------------------------------------------------------------------------------------------------------------------------------------------------------------------------------------------------------------------------------------------------------------
(357) 211 (344)
Gas, Power and Renewables
UK 163 39
Rest of Europe –– (9)
US (77) (59) (32)
Rest of World 124 (36) 26
--------------------------------------------------------------------------------------------------------------------------------------------------------------------------------------------------------------------------------------------------------------------------------------------------------
48 (32) 24
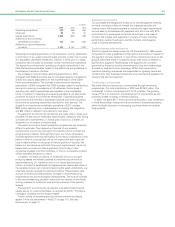
Reconciliation of non-GAAP information
Refining and Marketing
Profit before interest and tax adjusted for fair value accounting effects 6,429 4,830 7,270
Impact of fair value accounting effects (357) 211 (344)
--------------------------------------------------------------------------------------------------------------------------------------------------------------------------------------------------------------------------------------------------------------------------------------------------------
Profit before interest and tax 6,072 5,041 6,926
Gas, Power and Renewables
Profit before interest and tax adjusted for fair value accounting effects 626 1,238 1,389
Impact of fair value accounting effects 48 83 (217)
--------------------------------------------------------------------------------------------------------------------------------------------------------------------------------------------------------------------------------------------------------------------------------------------------------
Profit before interest and tax 674 1,321 1,172