BP 2007 Annual Report Download - page 115
Download and view the complete annual report
Please find page 115 of the 2007 BP annual report below. You can navigate through the pages in the report by either clicking on the pages listed below, or by using the keyword search tool below to find specific information within the annual report.-
 1
1 -
2
-
3
-
4
-
5
-
6
-
7
-
8
-
9
-
10
-
11
-
12
-
13
-
14
-
15
-
16
-
17
-
18
-
19
-
20
-
21
-
22
-
23
-
24
-
25
-
26
-
27
-
28
-
29
-
30
-
31
-
32
-
33
-
34
-
35
-
36
-
37
-
38
-
39
-
40
-
41
-
42
-
43
-
44
-
45
-
46
-
47
-
48
-
49
-
50
-
51
-
52
-
53
-
54
-
55
-
56
-
57
-
58
-
59
-
60
-
61
-
62
-
63
-
64
-
65
-
66
-
67
-
68
-
69
-
70
-
71
-
72
-
73
-
74
-
75
-
76
-
77
-
78
-
79
-
80
-
81
-
82
-
83
-
84
-
85
-
86
-
87
-
88
-
89
-
90
-
91
-
92
-
93
-
94
-
95
-
96
-
97
-
98
-
99
-
100
-
101
-
102
-
103
-
104
-
 105
105 -
 106
106 -
 107
107 -
 108
108 -
 109
109 -
 110
110 -
 111
111 -
 112
112 -
 113
113 -
 114
114 -
 115
115 -
 116
116 -
 117
117 -
 118
118 -
 119
119 -
 120
120 -
 121
121 -
 122
122 -
 123
123 -
 124
124 -
 125
125 -
126
-
127
-
128
-
129
-
130
-
131
-
132
-
133
-
134
-
135
-
136
-
137
-
138
-
139
-
140
-
141
-
142
-
143
-
144
-
145
-
146
-
147
-
148
-
149
-
150
-
151
-
152
-
153
-
154
-
155
-
156
-
157
-
158
-
159
-
160
-
161
-
162
-
163
-
164
-
165
-
166
-
167
-
168
-
169
-
170
-
171
-
172
-
173
-
174
-
175
-
176
-
177
-
178
-
179
-
180
-
181
-
182
-
183
-
184
-
185
-
186
-
187
-
188
-
189
-
190
-
191
-
192
-
193
-
194
-
195
-
196
-
197
-
198
-
199
-
200
-
201
-
202
-
203
-
204
-
205
-
206
-
207
-
208
-
209
-
210
-
211
-
212
 |
 |

BP ANNUAL REPORT AND ACCOUNTS 2007 113
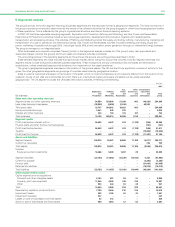
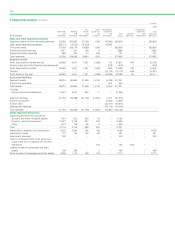
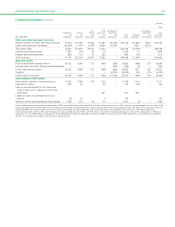
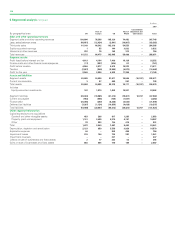
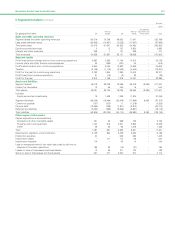
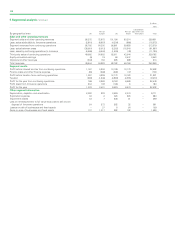
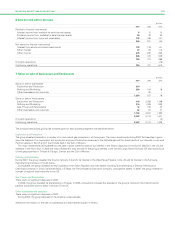
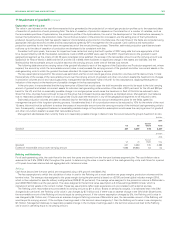
5 Segmental analysis
The group’s primary format for segment reporting is business segments and the secondary format is geographical segments. The risks and returns of
the group’s operations are primarily determined by the nature of the different activities that the group engages in, rather than the geographical location
of these operations. This is reflected by the group’s organizational structure and internal financial reporting systems.
In 2007, BP had three reportable operating segments: Exploration and Production; Refining and Marketing; and Gas, Power and Renewables.
Exploration and Production’s activities include oil and natural gas exploration, development and production, together with related pipeline,
transportation and processing activities. The activities of Refining and Marketing include the supply and trading, refining, manufacturing, marketing and
transportation of crude oil, petroleum and chemicals products. Gas, Power and Renewables activities included marketing and trading of gas and
power, marketing of liquefied natural gas (LNG), natural gas liquids (NGLs) and low-carbon power generation through our Alternative Energy business.
The group is managed on an integrated basis.
Other businesses and corporate comprises Treasury (which in the segmental analysis includes all of the group’s cash, cash equivalents and
associated interest income), the group’s aluminium asset and corporate activities worldwide.
The accounting policies of the operating segments are the same as the group’s accounting policies described in Note 1.
Sales between segments are made at prices that approximate market prices, taking into account the volumes involved. Segment revenues and
segment results include transactions between business segments. These transactions and any unrealized profits and losses are eliminated on
consolidation, unless unrealized losses provide evidence of an impairment of the asset transferred.
The group’s geographical segments are based on the location of the group’s assets. The UK and the US are significant countries of activity for the
group; the other geographical segments are groupings of countries determined by geographical location.
Sales to external customers are based on the location of the seller, which in most circumstances is not materially different from the location of the
customer. Crude oil and LNG are commodities for which there is an international market and buyers and sellers can be widely separated
geographically. The UK segment includes the UK-based international activities of Refining and Marketing.
$ million
--------------------------------------------------------------------------------------------------------------------------------------------------------------------------------------------------------------------------------------------------------------------------------------------------------
2007
--------------------------------------------------------------------------------------------------------------------------------------------------------------------------------------------------------------------------------------------------------------------------------------------------------
Gas, Other Consolidation
Exploration Refining Power businessess adjustment
and and and and and Total
By business Production Marketing Renewables corporate eliminations group
--------------------------------------------------------------------------------------------------------------------------------------------------------------------------------------------------------------------------------------------------------------------------------------------------------
Sales and other operating revenues
Segment sales and other operating revenues 54,550 250,866 21,369 843 (43,263) 284,365
Less: sales between businesses (38,803) (2,024) (2,436) – 43,263 –
--------------------------------------------------------------------------------------------------------------------------------------------------------------------------------------------------------------------------------------------------------------------------------------------------------
Third party sales 15,747 248,842 18,933 843 – 284,365
Equity-accounted earnings 3,061 538 233 – – 3,832
Interest and other revenues 330 134 123 167 – 754
--------------------------------------------------------------------------------------------------------------------------------------------------------------------------------------------------------------------------------------------------------------------------------------------------------
Total revenues 19,138 249,514 19,289 1,010 – 288,951
Segment results
Profit (loss) before interest and tax 26,938 6,072 674 (1,128) (204) 32,352
Finance costs and other finance income/expense ––––(741)
--------------------------------------------------------------------------------------------------------------------------------------------------------------------------------------------------------------------------------------------------------------------------------------------------------
Profit (loss) before taxation 26,938 6,072 674 (1,128) (945) 31,611
Taxation ––––(10,442)(10
--------------------------------------------------------------------------------------------------------------------------------------------------------------------------------------------------------------------------------------------------------------------------------------------------------
Profit (loss) for the year 26,938 6,072 674 (1,128) (11,387) 21,169
Assets and liabilities
Segment assets 108,874 95,691 19,889 17,188 (6,271) 235,371
Current tax receivable ––––705
--------------------------------------------------------------------------------------------------------------------------------------------------------------------------------------------------------------------------------------------------------------------------------------------------------
Total assets 108,874 95,691 19,889 17,188 (5,566) 236,076
--------------------------------------------------------------------------------------------------------------------------------------------------------------------------------------------------------------------------------------------------------------------------------------------------------
Includes
Equity-accounted investments 16,388 5,268 1,007 29 – 22,692
Segment liabilities (23,792) (41,053) (13,439) (14,940) 5,342 (87,882)
Current tax payable ––––(3,282)(3
Finance debt ––––(31,045)(31
Deferred tax liabilities ––––(19,215)(19
--------------------------------------------------------------------------------------------------------------------------------------------------------------------------------------------------------------------------------------------------------------------------------------------------------
Total liabilities (23,792) (41,053) (13,439) (14,940) (48,200) (141,424)
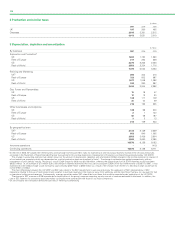
Other segment information
Capital expenditure and acquisitions
Goodwill and other intangible assets 2,153 581 98 21 – 2,853
Property, plant and equipment 11,360 4,565 746 216 – 16,887
Other 393 440 30 38 – 901
--------------------------------------------------------------------------------------------------------------------------------------------------------------------------------------------------------------------------------------------------------------------------------------------------------
Total 13,906 5,586 874 275 – 20,641
--------------------------------------------------------------------------------------------------------------------------------------------------------------------------------------------------------------------------------------------------------------------------------------------------------
Depreciation, depletion and amortization 7,720 2,430 215 214 – 10,579
Impairment losses 292 1,186 40 43 – 1,561
Impairment reversals 237––––
Losses on sale of businesses and fixed assets 42 313 – – – 355
Gains on sale of businesses and fixed assets 949 1,464 12 62 – 2,487
(741)
,442)
705
,282)
,045)
,215)
237