BP 2007 Annual Report Download - page 20
Download and view the complete annual report
Please find page 20 of the 2007 BP annual report below. You can navigate through the pages in the report by either clicking on the pages listed below, or by using the keyword search tool below to find specific information within the annual report.-
 1
1 -
2
-
3
-
4
-
5
-
6
-
7
-
8
-
9
-
 10
10 -
 11
11 -
 12
12 -
 13
13 -
 14
14 -
 15
15 -
 16
16 -
 17
17 -
 18
18 -
 19
19 -
 20
20 -
 21
21 -
 22
22 -
 23
23 -
 24
24 -
 25
25 -
 26
26 -
 27
27 -
 28
28 -
 29
29 -
 30
30 -
31
-
32
-
33
-
34
-
35
-
36
-
37
-
38
-
39
-
40
-
41
-
42
-
43
-
44
-
45
-
46
-
47
-
48
-
49
-
50
-
51
-
52
-
53
-
54
-
55
-
56
-
57
-
58
-
59
-
60
-
61
-
62
-
63
-
64
-
65
-
66
-
67
-
68
-
69
-
70
-
71
-
72
-
73
-
74
-
75
-
76
-
77
-
78
-
79
-
80
-
81
-
82
-
83
-
84
-
85
-
86
-
87
-
88
-
89
-
90
-
91
-
92
-
93
-
94
-
95
-
96
-
97
-
98
-
99
-
100
-
101
-
102
-
103
-
104
-
105
-
106
-
107
-
108
-
109
-
110
-
111
-
112
-
113
-
114
-
115
-
116
-
117
-
118
-
119
-
120
-
121
-
122
-
123
-
124
-
125
-
126
-
127
-
128
-
129
-
130
-
131
-
132
-
133
-
134
-
135
-
136
-
137
-
138
-
139
-
140
-
141
-
142
-
143
-
144
-
145
-
146
-
147
-
148
-
149
-
150
-
151
-
152
-
153
-
154
-
155
-
156
-
157
-
158
-
159
-
160
-
161
-
162
-
163
-
164
-
165
-
166
-
167
-
168
-
169
-
170
-
171
-
172
-
173
-
174
-
175
-
176
-
177
-
178
-
179
-
180
-
181
-
182
-
183
-
184
-
185
-
186
-
187
-
188
-
189
-
190
-
191
-
192
-
193
-
194
-
195
-
196
-
197
-
198
-
199
-
200
-
201
-
202
-
203
-
204
-
205
-
206
-
207
-
208
-
209
-
210
-
211
-
212
 |
 |

18
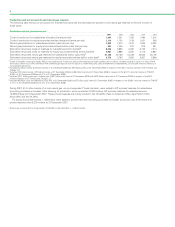
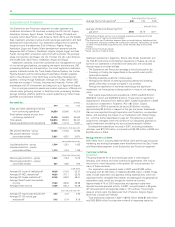
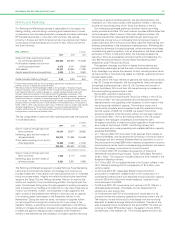
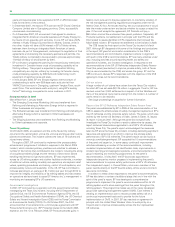
The following tables show BP’s production by major field for 2007, 2006 and 2005.
Liquids % thousand barrels per day
--------------------------------------------------------------------------------------------------------------------------------------------------------------------------------------------------------------------------------------------------------------------------------------------------------
a
BP net share of production
--------------------------------------------------------------------------------------------------------------------------------------------------------------------------------------------------------------------------------------------------------------------------------------------------------
Field or Area Interest 2007 2006 2005
--------------------------------------------------------------------------------------------------------------------------------------------------------------------------------------------------------------------------------------------------------------------------------------------------------
Alaska Prudhoe Bayb26.4 74 71 89
Kuparuk 39.2 52 57 62
Northstarb98.6 28 38 46
Milne Pointb99.4 28 31 37
Other Various 27 27 34
--------------------------------------------------------------------------------------------------------------------------------------------------------------------------------------------------------------------------------------------------------------------------------------------------------
Total Alaska 209 224 268
--------------------------------------------------------------------------------------------------------------------------------------------------------------------------------------------------------------------------------------------------------------------------------------------------------
Lower 48 onshorecVarious Various 108 125 130
--------------------------------------------------------------------------------------------------------------------------------------------------------------------------------------------------------------------------------------------------------------------------------------------------------
Gulf of Mexico deepwatercNa Kikab50.0 32 41 44
Horn Mountainb100.0 18 23 26
Kingb100.0 22 28 24
Mars 28.5 30 19 21
Mad Dogb61.0 25 17 13
Holsteinb50.0 17 15 22
Other Various 52 52 48
Gulf of Mexico ShelfcOther Various –316
--------------------------------------------------------------------------------------------------------------------------------------------------------------------------------------------------------------------------------------------------------------------------------------------------------
Total Gulf of Mexico 196 198 214
--------------------------------------------------------------------------------------------------------------------------------------------------------------------------------------------------------------------------------------------------------------------------------------------------------
Total US 513 547 612
UK offshorecETAPdVarious 32 49 49
FoinavenbVarious 37 37 39
Magnusb85.0 16 30 30
Schiehallion/LoyalbVarious 20 26 28
Hardingb70.0 14 17 22
Andrewb62.8 8712
Other Various 59 69 75
--------------------------------------------------------------------------------------------------------------------------------------------------------------------------------------------------------------------------------------------------------------------------------------------------------
Total UK offshore 186 235 255
--------------------------------------------------------------------------------------------------------------------------------------------------------------------------------------------------------------------------------------------------------------------------------------------------------
Onshore Wytch Farmb67.8 15 18 22
--------------------------------------------------------------------------------------------------------------------------------------------------------------------------------------------------------------------------------------------------------------------------------------------------------
Total UK 201 253 277
NetherlandscVarious Various –11
Norway Valhallb28.1 17 21 25
Draugen 18.4 14 15 20
Ulab80.0 12 14 17
Other Various 810 12
--------------------------------------------------------------------------------------------------------------------------------------------------------------------------------------------------------------------------------------------------------------------------------------------------------
Total Rest of Europe 51 61 75
Angola Dalia 16.7 31 ––
Girassol 16.7 14 17 34
Greater Plutoniob50.0 12 ––
Kizomba A 26.7 36 54 56
Kizomba B 26.7 35 58 28
Other Various 11 410
Australia Various 15.8 34 34 36
Azerbaijan Azeri-Chirag-Gunashlib34.1 200 145 76
Shah Denizb25.5 5––
CanadacVariousbVarious 8810
Colombia VariousbVarious 28 34 41
Egypt Various Various 43 42 47
Trinidad & TobagocVariousb100.0 30 40 40
VenezuelacVarious Various 16 26 55
OthercVarious Various 36 28 26
--------------------------------------------------------------------------------------------------------------------------------------------------------------------------------------------------------------------------------------------------------------------------------------------------------
Total Rest of World 539 490 459
Total groupe1,304 1,351 1,423
Equity-accounted entities (BP share)
Abu DhabifVarious Various 192 163 148
Argentina – Pan American Energy Various Various 69 69 67
Russia – TNK-BPcVarious Various 832 876 911
OthercVarious Various 17 16 13
--------------------------------------------------------------------------------------------------------------------------------------------------------------------------------------------------------------------------------------------------------------------------------------------------------
Total equity-accounted entities 1,110 1,124 1,139
----------------------------------------------------------------------------------------------------------------------------------------------------------------------------------------------------------------------------------------------------------------------------------------------------------------------
aProduction excludes royalties due to others whether payable in cash or in kind where the royalty owner has a direct interest in the underlying production and the option and
ability to make lifting and sales arrangements independently.
bBP-operated.
cIn 2007, BP divested its producing properties in the Netherlands and some producing properties in the US Lower 48 and Canada. TNK-BP disposed of its interests in
several non-core properties. In 2006, BP divested its producing properties on the Outer Continental Shelf of the Gulf of Mexico and its interest in the Statfjord oil and gas
field in the UK. Our interests in the Boqueron, Desarollo Zulia Occidental (DZO) and Jusepin projects in Venezuela were reduced following a decision by the Venezuelan
government. TNK-BP disposed of its non-core interests in the Udmurtneft assets. In 2005, BP divested the Teak, Samaan and Poui assets in Trinidad and sold interests in
certain properties in the Gulf of Mexico. In addition, BP exchanged the Gulf of Mexico deepwater Blind Faith prospect for Kerr McGee’s interest in the Arkoma Red Oak
and Williburton fields, and TNK-BP disposed of non-core producing assets in the Saratov region.
dVolumes relate to six BP-operated fields within ETAP. BP has no interests in the remaining three ETAP fields, which are operated by Shell.
eIncludes 54 net mboe/d of NGLs from processing plants in which BP has an interest (2006 55mboe/d and 2005 58mboe/d).
fThe BP group holds interests, through associates, in onshore and offshore concessions in Abu Dhabi, expiring in 2014 and 2018 respectively. During the second quarter of
2007, we updated our reporting policy in Abu Dhabi to be consistent with general industry practice and as a result have started reporting production and reserves there
gross of production taxes. This change resulted in an increase in our reserves of 153 million barrels and in our production of 33 thousand barrels per day (mb/d).