BP 2007 Annual Report Download - page 120
Download and view the complete annual report
Please find page 120 of the 2007 BP annual report below. You can navigate through the pages in the report by either clicking on the pages listed below, or by using the keyword search tool below to find specific information within the annual report.-
 1
1 -
2
-
3
-
4
-
5
-
6
-
7
-
8
-
9
-
10
-
11
-
12
-
13
-
14
-
15
-
16
-
17
-
18
-
19
-
20
-
21
-
22
-
23
-
24
-
25
-
26
-
27
-
28
-
29
-
30
-
31
-
32
-
33
-
34
-
35
-
36
-
37
-
38
-
39
-
40
-
41
-
42
-
43
-
44
-
45
-
46
-
47
-
48
-
49
-
50
-
51
-
52
-
53
-
54
-
55
-
56
-
57
-
58
-
59
-
60
-
61
-
62
-
63
-
64
-
65
-
66
-
67
-
68
-
69
-
70
-
71
-
72
-
73
-
74
-
75
-
76
-
77
-
78
-
79
-
80
-
81
-
82
-
83
-
84
-
85
-
86
-
87
-
88
-
89
-
90
-
91
-
92
-
93
-
94
-
95
-
96
-
97
-
98
-
99
-
100
-
101
-
102
-
103
-
104
-
105
-
106
-
107
-
108
-
109
-
 110
110 -
 111
111 -
 112
112 -
 113
113 -
 114
114 -
 115
115 -
 116
116 -
 117
117 -
 118
118 -
 119
119 -
 120
120 -
 121
121 -
 122
122 -
 123
123 -
 124
124 -
 125
125 -
 126
126 -
 127
127 -
 128
128 -
 129
129 -
 130
130 -
131
-
132
-
133
-
134
-
135
-
136
-
137
-
138
-
139
-
140
-
141
-
142
-
143
-
144
-
145
-
146
-
147
-
148
-
149
-
150
-
151
-
152
-
153
-
154
-
155
-
156
-
157
-
158
-
159
-
160
-
161
-
162
-
163
-
164
-
165
-
166
-
167
-
168
-
169
-
170
-
171
-
172
-
173
-
174
-
175
-
176
-
177
-
178
-
179
-
180
-
181
-
182
-
183
-
184
-
185
-
186
-
187
-
188
-
189
-
190
-
191
-
192
-
193
-
194
-
195
-
196
-
197
-
198
-
199
-
200
-
201
-
202
-
203
-
204
-
205
-
206
-
207
-
208
-
209
-
210
-
211
-
212
 |
 |

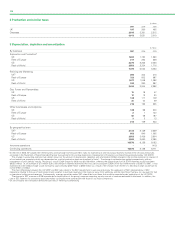
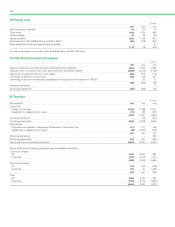
118
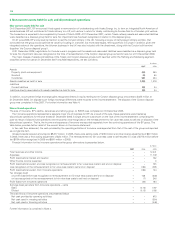
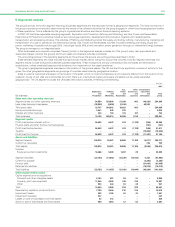
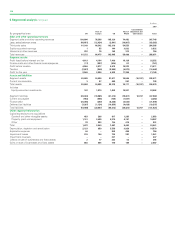
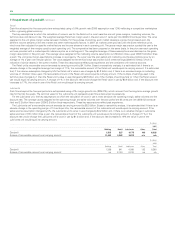
5 Segmental analysis continued
$ million
--------------------------------------------------------------------------------------------------------------------------------------------------------------------------------------------------------------------------------------------------------------------------------------------------------
2005
--------------------------------------------------------------------------------------------------------------------------------------------------------------------------------------------------------------------------------------------------------------------------------------------------------
Consolidation
Rest of Rest of adjustment and
By geographical area UK Europe US World eliminations Total
--------------------------------------------------------------------------------------------------------------------------------------------------------------------------------------------------------------------------------------------------------------------------------------------------------
Sales and other operating revenues
Segment sales and other operating revenues 95,375 72,972 101,190 60,314 – 329,851
Less: sales attributable to Innovene operations (2,610) (8,667) (4,309) (686) – (16,272)
--------------------------------------------------------------------------------------------------------------------------------------------------------------------------------------------------------------------------------------------------------------------------------------------------------
Segment revenues from continuing operations 92,765 64,305 96,881 59,628 – 313,579
Less: sales between areas (38,081) (5,013) (2,362) (16,541) – (61,997)
Less: sales by continuing operations to Innovene (5,599) (4,640) (1,508) (43) – (11,790)
--------------------------------------------------------------------------------------------------------------------------------------------------------------------------------------------------------------------------------------------------------------------------------------------------------
Third party sales of continuing operations 49,085 54,652 93,011 43,044 – 239,792
Equity-accounted earnings (8) 18 86 3,447 – 3,543
Interest and other revenues (533) 152 695 299 – 613
--------------------------------------------------------------------------------------------------------------------------------------------------------------------------------------------------------------------------------------------------------------------------------------------------------
Total revenues 48,544 54,822 93,792 46,790 – 243,948
Segment results
Profit before interest and tax from continuing operations 1,167 5,206 13,139 13,170 – 32,682
Finance costs and other finance expense (80) (268) (366) (47) – (761)
--------------------------------------------------------------------------------------------------------------------------------------------------------------------------------------------------------------------------------------------------------------------------------------------------------
Profit before taxation from continuing operations 1,087 4,938 12,773 13,123 – 31,921
Taxation (289) (1,646) (3,983) (3,555) – (9,473)
--------------------------------------------------------------------------------------------------------------------------------------------------------------------------------------------------------------------------------------------------------------------------------------------------------
Profit for the year from continuing operations 798 3,292 8,790 9,568 – 22,448
Profit (loss) from Innovene operations 234 109 (165) 6 – 184
--------------------------------------------------------------------------------------------------------------------------------------------------------------------------------------------------------------------------------------------------------------------------------------------------------
Profit for the year 1,032 3,401 8,625 9,574 – 22,632
Other segment information
Depreciation, depletion and amortization 2,080 932 3,685 2,074 – 8,771
Exploration expense 32 2 425 225 – 684
Impairment losses 53 7 238 61 – 359
Loss on remeasurement to fair value less costs to sell and on
disposal of Innovene operations 24 273 262 32 – 591
Losses on sale of businesses and fixed assets –37 864 –1
Gains on sale of businesses and fixed assets 107 1,017 282 132 – 1,538
09