BP 2007 Annual Report Download - page 121
Download and view the complete annual report
Please find page 121 of the 2007 BP annual report below. You can navigate through the pages in the report by either clicking on the pages listed below, or by using the keyword search tool below to find specific information within the annual report.-
 1
1 -
2
-
3
-
4
-
5
-
6
-
7
-
8
-
9
-
10
-
11
-
12
-
13
-
14
-
15
-
16
-
17
-
18
-
19
-
20
-
21
-
22
-
23
-
24
-
25
-
26
-
27
-
28
-
29
-
30
-
31
-
32
-
33
-
34
-
35
-
36
-
37
-
38
-
39
-
40
-
41
-
42
-
43
-
44
-
45
-
46
-
47
-
48
-
49
-
50
-
51
-
52
-
53
-
54
-
55
-
56
-
57
-
58
-
59
-
60
-
61
-
62
-
63
-
64
-
65
-
66
-
67
-
68
-
69
-
70
-
71
-
72
-
73
-
74
-
75
-
76
-
77
-
78
-
79
-
80
-
81
-
82
-
83
-
84
-
85
-
86
-
87
-
88
-
89
-
90
-
91
-
92
-
93
-
94
-
95
-
96
-
97
-
98
-
99
-
100
-
101
-
102
-
103
-
104
-
105
-
106
-
107
-
108
-
109
-
110
-
 111
111 -
 112
112 -
 113
113 -
 114
114 -
 115
115 -
 116
116 -
 117
117 -
 118
118 -
 119
119 -
 120
120 -
 121
121 -
 122
122 -
 123
123 -
 124
124 -
 125
125 -
 126
126 -
 127
127 -
 128
128 -
 129
129 -
 130
130 -
 131
131 -
132
-
133
-
134
-
135
-
136
-
137
-
138
-
139
-
140
-
141
-
142
-
143
-
144
-
145
-
146
-
147
-
148
-
149
-
150
-
151
-
152
-
153
-
154
-
155
-
156
-
157
-
158
-
159
-
160
-
161
-
162
-
163
-
164
-
165
-
166
-
167
-
168
-
169
-
170
-
171
-
172
-
173
-
174
-
175
-
176
-
177
-
178
-
179
-
180
-
181
-
182
-
183
-
184
-
185
-
186
-
187
-
188
-
189
-
190
-
191
-
192
-
193
-
194
-
195
-
196
-
197
-
198
-
199
-
200
-
201
-
202
-
203
-
204
-
205
-
206
-
207
-
208
-
209
-
210
-
211
-
212
 |
 |

BP ANNUAL REPORT AND ACCOUNTS 2007 119
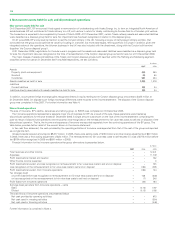
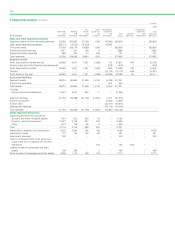
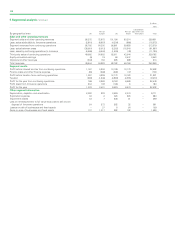
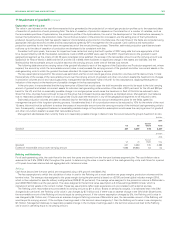
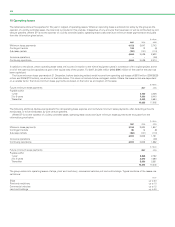
6 Interest and other revenues
$ million
--------------------------------------------------------------------------------------------------------------------------------------------------------------------------------------------------------------------------------------------------------------------------------------------------------
2007 2006 2005
--------------------------------------------------------------------------------------------------------------------------------------------------------------------------------------------------------------------------------------------------------------------------------------------------------
Related to financial instruments
Interest income from available-for-sale financial assets 513 14
Dividend income from available-for-sale financial assets 29 32 25
Interest income from loans and receivables 175 186 101
--------------------------------------------------------------------------------------------------------------------------------------------------------------------------------------------------------------------------------------------------------------------------------------------------------
209 231 140
--------------------------------------------------------------------------------------------------------------------------------------------------------------------------------------------------------------------------------------------------------------------------------------------------------
Not related to financial instruments
Interest from equity-accounted investments 172 176 141
Other interest 97 62 116
Other income 276 232 292
--------------------------------------------------------------------------------------------------------------------------------------------------------------------------------------------------------------------------------------------------------------------------------------------------------
545 470 549
--------------------------------------------------------------------------------------------------------------------------------------------------------------------------------------------------------------------------------------------------------------------------------------------------------
754 701 689
Innovene operations ––(7
--------------------------------------------------------------------------------------------------------------------------------------------------------------------------------------------------------------------------------------------------------------------------------------------------------
Continuing operations 754 701 613
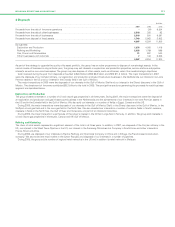
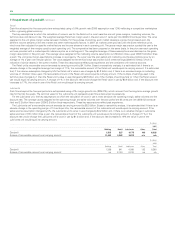
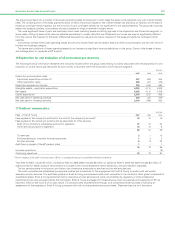
7 Gains on sale of businesses and fixed assets
$ million
--------------------------------------------------------------------------------------------------------------------------------------------------------------------------------------------------------------------------------------------------------------------------------------------------------
2007 2006 2005
--------------------------------------------------------------------------------------------------------------------------------------------------------------------------------------------------------------------------------------------------------------------------------------------------------
Gains on sale of businesses
Exploration and Production 534 –
Refining and Marketing 850 104 18
Other businesses and corporate –63 –
--------------------------------------------------------------------------------------------------------------------------------------------------------------------------------------------------------------------------------------------------------------------------------------------------------
1,384 167 18
--------------------------------------------------------------------------------------------------------------------------------------------------------------------------------------------------------------------------------------------------------------------------------------------------------
Gains on sale of fixed assets
Exploration and Production 415 2,309 1,198
Refining and Marketing 614 1,008 223
Gas, Power and Renewables 12 193 55
Other businesses and corporate 62 37 47
--------------------------------------------------------------------------------------------------------------------------------------------------------------------------------------------------------------------------------------------------------------------------------------------------------
1,103 3,547 1,523
--------------------------------------------------------------------------------------------------------------------------------------------------------------------------------------------------------------------------------------------------------------------------------------------------------
2,487 3,714 1,541
Innovene operations –– (3)
--------------------------------------------------------------------------------------------------------------------------------------------------------------------------------------------------------------------------------------------------------------------------------------------------------
Continuing operations 2,487 3,714 1,538
The principal transactions giving rise to these gains for each business segment are described below.
Exploration and Production
The group divested interests in a number of oil and natural gas properties in all three years. The major divestments during 2007 that resulted in gains
were the disposal of an exploration and production and gas infrastructure business in the Netherlands and the divestments of our interests in non-core
Permian assets in the US and in the Entrada field in the Gulf of Mexico.
The major divestments during 2006 that resulted in gains were the sales of our interest in the Shenzi discovery in the Gulf of Mexico in the US and
interests in the North Sea. In 2005 the major divestment was the sale of the group’s interest in the Ormen Lange field in Norway. BP also sold various
oil and gas properties in Trinidad & Tobago, Canada and the Gulf of Mexico.
Refining and Marketing
During 2007, the group divested the Coryton refinery in the UK, its interest in the West Texas Pipeline in the US and its interest in the Samsung
Petrochemical Company in South Korea.
During 2006, the group divested its retail business in the Czech Republic and fixed assets including its shareholding in Zhenhai Refining and
Chemicals Company in China, its shareholding in Eiffage, the French-based construction company, and pipeline assets. In 2005, the group divested a
number of regional retail networks in the US.
Gas, Power and Renewables
There were no significant disposals in 2007.
In 2006, the group divested its shareholding in Enagas. In 2005, transactions included the disposal of the group’s interest in the Interconnector
pipeline and power plant at Great Yarmouth in the UK.
Other businesses and corporate
There were no significant disposals in 2007.
During 2006, the group disposed of its ethylene oxide business.
Additional information on the sale of businesses and fixed assets is given in Note 4.
6)
–