BP 2007 Annual Report Download - page 147
Download and view the complete annual report
Please find page 147 of the 2007 BP annual report below. You can navigate through the pages in the report by either clicking on the pages listed below, or by using the keyword search tool below to find specific information within the annual report.-
 1
1 -
2
-
3
-
4
-
5
-
6
-
7
-
8
-
9
-
10
-
11
-
12
-
13
-
14
-
15
-
16
-
17
-
18
-
19
-
20
-
21
-
22
-
23
-
24
-
25
-
26
-
27
-
28
-
29
-
30
-
31
-
32
-
33
-
34
-
35
-
36
-
37
-
38
-
39
-
40
-
41
-
42
-
43
-
44
-
45
-
46
-
47
-
48
-
49
-
50
-
51
-
52
-
53
-
54
-
55
-
56
-
57
-
58
-
59
-
60
-
61
-
62
-
63
-
64
-
65
-
66
-
67
-
68
-
69
-
70
-
71
-
72
-
73
-
74
-
75
-
76
-
77
-
78
-
79
-
80
-
81
-
82
-
83
-
84
-
85
-
86
-
87
-
88
-
89
-
90
-
91
-
92
-
93
-
94
-
95
-
96
-
97
-
98
-
99
-
100
-
101
-
102
-
103
-
104
-
105
-
106
-
107
-
108
-
109
-
110
-
111
-
112
-
113
-
114
-
115
-
116
-
117
-
118
-
119
-
120
-
121
-
122
-
123
-
124
-
125
-
126
-
127
-
128
-
129
-
130
-
131
-
132
-
133
-
134
-
135
-
136
-
 137
137 -
 138
138 -
 139
139 -
 140
140 -
 141
141 -
 142
142 -
 143
143 -
 144
144 -
 145
145 -
 146
146 -
 147
147 -
 148
148 -
 149
149 -
 150
150 -
 151
151 -
 152
152 -
 153
153 -
 154
154 -
 155
155 -
 156
156 -
 157
157 -
158
-
159
-
160
-
161
-
162
-
163
-
164
-
165
-
166
-
167
-
168
-
169
-
170
-
171
-
172
-
173
-
174
-
175
-
176
-
177
-
178
-
179
-
180
-
181
-
182
-
183
-
184
-
185
-
186
-
187
-
188
-
189
-
190
-
191
-
192
-
193
-
194
-
195
-
196
-
197
-
198
-
199
-
200
-
201
-
202
-
203
-
204
-
205
-
206
-
207
-
208
-
209
-
210
-
211
-
212
 |
 |

BP ANNUAL REPORT AND ACCOUNTS 2007 145
1
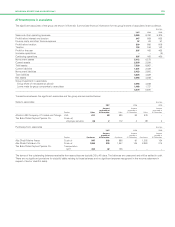
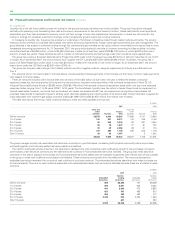
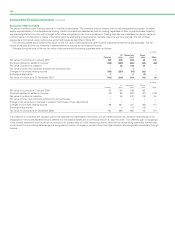
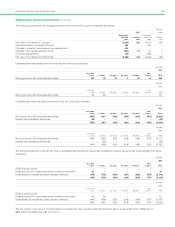
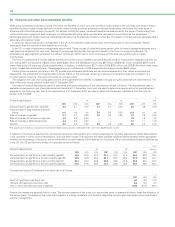
34 Derivative financial instruments continued
The following table shows the changes in the day-one profits deferred on the balance sheet.
$ million
--------------------------------------------------------------------------------------------------------------------------------------------------------------------------------------------------------------------------------------------------------------------------------------------------------
2007 2006
--------------------------------------------------------------------------------------------------------------------------------------------------------------------------------------------------------------------------------------------------------------------------------------------------------
Natural Natural
gas price Power price gas price Power price
--------------------------------------------------------------------------------------------------------------------------------------------------------------------------------------------------------------------------------------------------------------------------------------------------------
Fair value of contracts not recognized through the income statement at 1 January 36 – 39 10
Fair value of new contracts at inception not recognized in the income statement 1–2
Fair value recognized in the income statement (1) – (5) (11)
--------------------------------------------------------------------------------------------------------------------------------------------------------------------------------------------------------------------------------------------------------------------------------------------------------
Fair value of contracts not recognized through profit at 31 December 36 – 36 –
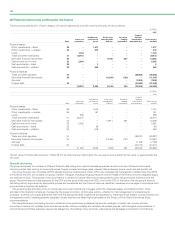
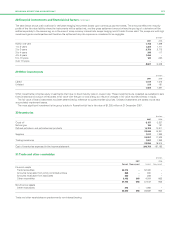
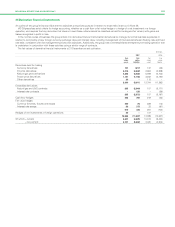
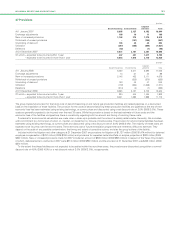
Derivative assets held for trading have the following fair values and maturities.
$ million
--------------------------------------------------------------------------------------------------------------------------------------------------------------------------------------------------------------------------------------------------------------------------------------------------------
2007
--------------------------------------------------------------------------------------------------------------------------------------------------------------------------------------------------------------------------------------------------------------------------------------------------------
Less than Over
1 year 1-2 years 2-3 years 3-4 years 4-5 years 5 years Total
--------------------------------------------------------------------------------------------------------------------------------------------------------------------------------------------------------------------------------------------------------------------------------------------------------
Currency derivatives 123106512
Oil price derivatives 2,545 471 113 39 26 20 3,214
Natural gas price derivatives 2,170 677 333 283 216 709 4,388
Power price derivatives 819 250 52 – – – 1,121
Other derivatives 1218––––
--------------------------------------------------------------------------------------------------------------------------------------------------------------------------------------------------------------------------------------------------------------------------------------------------------
5,669 1,426 504 327 243 731 8,900
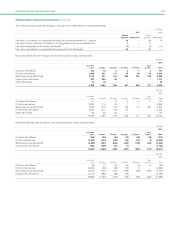
$ million
--------------------------------------------------------------------------------------------------------------------------------------------------------------------------------------------------------------------------------------------------------------------------------------------------------
2006
--------------------------------------------------------------------------------------------------------------------------------------------------------------------------------------------------------------------------------------------------------------------------------------------------------
Less than Over
1 year 1-2 years 2-3 years 3-4 years 4-5 years 5 years Total
--------------------------------------------------------------------------------------------------------------------------------------------------------------------------------------------------------------------------------------------------------------------------------------------------------
Currency derivatives 117 – 12 3 2 3 137
Oil price derivatives 2,520 116 20 7 1 – 2,664
Natural gas price derivatives 4,532 919 374 166 114 453 6,558
Power price derivatives 2,845 274 86 27 – – 3,232
Other derivatives 64 26 23 – – – 113
--------------------------------------------------------------------------------------------------------------------------------------------------------------------------------------------------------------------------------------------------------------------------------------------------------
10,078 1,335 515 203 117 456 12,704
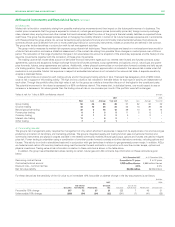
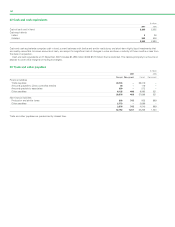
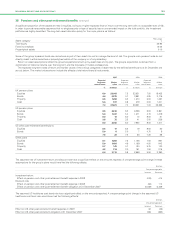
Derivative liabilities held for trading have the following fair values and maturities.
$ million
--------------------------------------------------------------------------------------------------------------------------------------------------------------------------------------------------------------------------------------------------------------------------------------------------------
2007
--------------------------------------------------------------------------------------------------------------------------------------------------------------------------------------------------------------------------------------------------------------------------------------------------------
Less than Over
1 year 1-2 years 2-3 years 3-4 years 4-5 years 5 years Total
--------------------------------------------------------------------------------------------------------------------------------------------------------------------------------------------------------------------------------------------------------------------------------------------------------
Currency derivatives (145) (99) (32) (16) (15) (10) (317)
Oil price derivatives (2,735) (512) (135) (25) (22) (3) (3,432)
Natural gas price derivatives (2,089) (527) (298) (219) (185) (704) (4,022)
Power price derivatives (832) (246) (61) (1) – – (1,140)
--------------------------------------------------------------------------------------------------------------------------------------------------------------------------------------------------------------------------------------------------------------------------------------------------------
(5,801) (1,384) (526) (261) (222) (717) (8,911)
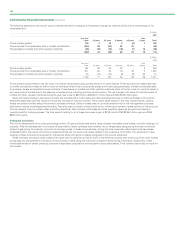
$ million
--------------------------------------------------------------------------------------------------------------------------------------------------------------------------------------------------------------------------------------------------------------------------------------------------------
2006
--------------------------------------------------------------------------------------------------------------------------------------------------------------------------------------------------------------------------------------------------------------------------------------------------------
Less than Over
1 year 1-2 years 2-3 years 3-4 years 4-5 years 5 years Total
--------------------------------------------------------------------------------------------------------------------------------------------------------------------------------------------------------------------------------------------------------------------------------------------------------
Currency derivatives (8) (7) (12) (2) (2) (1) (32)
Oil price derivatives (2,230) (89) (29) (19) (1) – (2,368)
Natural gas price derivatives (3,931) (875) (273) (109) (86) (429) (5,703)
Power price derivatives (2,777) (289) (98) (26) – – (3,190)
--------------------------------------------------------------------------------------------------------------------------------------------------------------------------------------------------------------------------------------------------------------------------------------------------------
(8,946) (1,260) (412) (156) (89) (430) (11,293)
147
30