BP 2007 Annual Report Download - page 49
Download and view the complete annual report
Please find page 49 of the 2007 BP annual report below. You can navigate through the pages in the report by either clicking on the pages listed below, or by using the keyword search tool below to find specific information within the annual report.-
 1
1 -
2
-
3
-
4
-
5
-
6
-
7
-
8
-
9
-
10
-
11
-
12
-
13
-
14
-
15
-
16
-
17
-
18
-
19
-
20
-
21
-
22
-
23
-
24
-
25
-
26
-
27
-
28
-
29
-
30
-
31
-
32
-
33
-
34
-
35
-
36
-
37
-
38
-
 39
39 -
 40
40 -
 41
41 -
 42
42 -
 43
43 -
 44
44 -
 45
45 -
 46
46 -
 47
47 -
 48
48 -
 49
49 -
 50
50 -
 51
51 -
 52
52 -
 53
53 -
 54
54 -
 55
55 -
 56
56 -
 57
57 -
 58
58 -
 59
59 -
60
-
61
-
62
-
63
-
64
-
65
-
66
-
67
-
68
-
69
-
70
-
71
-
72
-
73
-
74
-
75
-
76
-
77
-
78
-
79
-
80
-
81
-
82
-
83
-
84
-
85
-
86
-
87
-
88
-
89
-
90
-
91
-
92
-
93
-
94
-
95
-
96
-
97
-
98
-
99
-
100
-
101
-
102
-
103
-
104
-
105
-
106
-
107
-
108
-
109
-
110
-
111
-
112
-
113
-
114
-
115
-
116
-
117
-
118
-
119
-
120
-
121
-
122
-
123
-
124
-
125
-
126
-
127
-
128
-
129
-
130
-
131
-
132
-
133
-
134
-
135
-
136
-
137
-
138
-
139
-
140
-
141
-
142
-
143
-
144
-
145
-
146
-
147
-
148
-
149
-
150
-
151
-
152
-
153
-
154
-
155
-
156
-
157
-
158
-
159
-
160
-
161
-
162
-
163
-
164
-
165
-
166
-
167
-
168
-
169
-
170
-
171
-
172
-
173
-
174
-
175
-
176
-
177
-
178
-
179
-
180
-
181
-
182
-
183
-
184
-
185
-
186
-
187
-
188
-
189
-
190
-
191
-
192
-
193
-
194
-
195
-
196
-
197
-
198
-
199
-
200
-
201
-
202
-
203
-
204
-
205
-
206
-
207
-
208
-
209
-
210
-
211
-
212
 |
 |

BP ANNUAL REPORT AND ACCOUNTS 2007 47
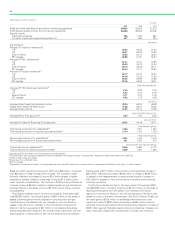
Profit attributable to BP shareholders for the year ended 31 December
2005 included net gains of $1,429 million on the disposal of assets; and
was after net fair value losses of $2,047 million on embedded
derivatives, a charge of $700 million in respect of the March 2005 Texas
City refinery incident, a charge of $412 million in respect of new, and
revisions to existing, environmental and other provisions, an impairment
charge of $359 million and a charge of $134 million relating to the
separation of the Olefins and Derivatives business.
(See Environmental expenditure on page 53 for more information on
environmental charges.)
The primary additional factors reflected in profit for 2007, compared
with 2006, were higher liquids realizations, stronger refining and
marketing margins and improved NGLs performance; however, these
were more than offset by lower gas realizations, lower reported
production volumes, higher production taxes in Alaska, higher costs
(primarily reflecting the impact of sector-specific inflation and higher
integrity spend), the impact of outages and recommissioning costs at the
Texas City and Whiting refineries, reduced supply optimization benefits
and a lower contribution from the marketing and trading business in the
Gas, Power and Renewables segment.
The primary additional factors reflected in profit attributable to BP
shareholders for the year ended 31 December 2006 compared with 2005
were higher oil realizations, higher refining margins (including the benefit
of supply optimization), higher retail margins (although this was partially
offset by a deterioration in other marketing margins) and higher
contributions from the operating businesses in the Gas, Power and
Renewables segment; these were offset by the ongoing impact
following the Texas City refinery shutdown, lower gas realizations, lower
production volumes and higher costs.
Profits and margins for the group and for individual business segments
can vary significantly from period to period as a result of changes in such
factors as oil prices, natural gas prices and refining margins. Accordingly,
the results for the current and prior periods do not necessarily reflect
trends, nor do they provide indicators of results for future periods.
Employee numbers were approximately 97,600 at 31 December 2007,
97,000 at 31 December 2006 and 96,200 at 31 December 2005.
aInventory holding gains and losses represent the difference between the cost of
sales calculated using the average cost of supplies incurred during the year and the
cost of sales calculated on the first-in first-out (FIFO) method. Under the FIFO
method, which we use for IFRS reporting, the cost of inventory charged to the
income statement is based on the historic cost of acquisition or manufacture rather
than the current replacement cost. In volatile energy markets, this can have a
significant distorting effect on reported income. The amounts disclosed represent
the difference between the charge to the income statement on a FIFO basis and
the charge that would arise using average cost of supplies incurred during the
period. For this purpose average cost of supplies incurred during the period is
calculated by dividing the total cost of inventory purchased in the period by the
number of barrels acquired. The amounts disclosed are not separately reflected in
the financial statements as a gain or loss.
BP’s management believes this information is useful to illustrate to investors the
fact that crude oil and product prices can vary significantly from period to period and
that the impact on our reported result under IFRS can be significant. Inventory
holding gains and losses vary from period to period due principally to changes in oil
prices as well as changes to underlying inventory levels. In order for investors to
understand the operating performance of the group excluding the impact of oil price
changes on the replacement of inventories, and to make comparisons of operating
performance between reporting periods, BP’s management believes it is helpful to
disclose this information.
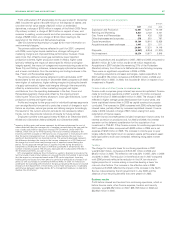
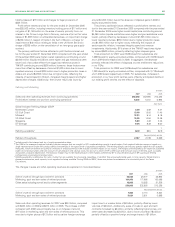
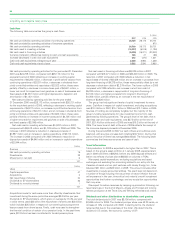
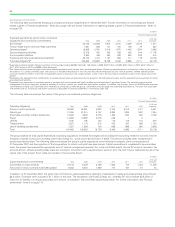
Capital expenditure and acquisitions
$ million
------------------------------------------------------------------------------------------------------------------------------------------------
2007 2006 2005
------------------------------------------------------------------------------------------------------------------------------------------------
Exploration and Production 13,661 13,075 10,149
Refining and Marketing 4,447 3,122 2,757
Gas, Power and Renewables 811 432 235
Other businesses and corporate 275 281 797
------------------------------------------------------------------------------------------------------------------------------------------------
Capital expenditure 19,194 16,910 13,938
Acquisitions and asset exchanges 1,447 321 211
------------------------------------------------------------------------------------------------------------------------------------------------
20,641 17,231 14,149
Disposals (4,267) (6,254) (11,200)
------------------------------------------------------------------------------------------------------------------------------------------------
Net investment 16,374 10,977 2,949
Capital expenditure and acquisitions in 2007, 2006 and 2005 amounted to
$20,641 million, $17,231 million and $14,149 million respectively.
Acquisitions in 2007 included the remaining 31% of the Rotterdam
(Nerefco) refinery from Chevron’s Netherlands manufacturing company.
There were no significant acquisitions in 2006 or 2005.
Excluding acquisitions and asset exchanges, capital expenditure for
2007 was $19,194 million compared with $16,910 million in 2006 and
$13,938 million in 2005. In 2006, this included $1 billion in respect of our
investment in Rosneft.
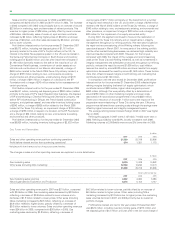
Finance costs and other finance income/expense
Finance costs comprises group interest less amounts capitalized. Finance
costs for continuing operations in 2007 were $1,110 million compared
with $718 million in 2006 and $616 million in 2005. The charge in 2007
reflected a higher average gross debt balance than in prior years, and
lower capitalized interest than in 2006 as capital construction projects
concluded. The increase for 2006 compared with 2005 reflected higher
interest rates, partially offset by increased capitalized interest. Finance
costs in 2005 included a charge of $57 million arising from early
redemption of finance leases.
Other finance income/expense included net pension finance costs, the
interest accretion on provisions and, for 2005 and 2006, the interest
accretion on the deferred consideration for the acquisition of our
investment in TNK-BP. Other finance income for continuing operations in
2007 was $369 million compared with $202 million in 2006 and a net
expense of $145 million in 2005. The increase in income year on year
largely reflects the higher return on pension assets as the pension asset
base applicable to each year increased, reflecting rising asset market
valuations.
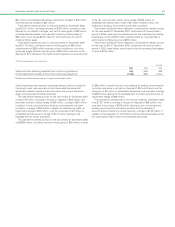
Taxation
The charge for corporate taxes for continuing operations in 2007
was $10,442 million, compared with $12,331 million in 2006 and
$9,473 million in 2005. The effective rate was 33% in 2007, 36% in 2006
and 30% in 2005. The reduction in the effective rate in 2007 compared
with 2006 primarily reflects the reduction in the UK tax rate and a
higher proportion of income arising in countries bearing a lower tax
rate and other factors. The increase in the effective rate in 2006
compared with 2005 reflected the impact of the increase in the North
Sea tax rate enacted by the UK government in July 2006 and the
absence of non-recurring benefits that were present in 2005.
Business results
Profit before interest and taxation from continuing operations, which is
before finance costs, other finance expense, taxation and minority
interests, was $32,352 million in 2007, $35,158 million in 2006 and
$32,682 million in 2005.