BP 2007 Annual Report Download - page 124
Download and view the complete annual report
Please find page 124 of the 2007 BP annual report below. You can navigate through the pages in the report by either clicking on the pages listed below, or by using the keyword search tool below to find specific information within the annual report.-
 1
1 -
2
-
3
-
4
-
5
-
6
-
7
-
8
-
9
-
10
-
11
-
12
-
13
-
14
-
15
-
16
-
17
-
18
-
19
-
20
-
21
-
22
-
23
-
24
-
25
-
26
-
27
-
28
-
29
-
30
-
31
-
32
-
33
-
34
-
35
-
36
-
37
-
38
-
39
-
40
-
41
-
42
-
43
-
44
-
45
-
46
-
47
-
48
-
49
-
50
-
51
-
52
-
53
-
54
-
55
-
56
-
57
-
58
-
59
-
60
-
61
-
62
-
63
-
64
-
65
-
66
-
67
-
68
-
69
-
70
-
71
-
72
-
73
-
74
-
75
-
76
-
77
-
78
-
79
-
80
-
81
-
82
-
83
-
84
-
85
-
86
-
87
-
88
-
89
-
90
-
91
-
92
-
93
-
94
-
95
-
96
-
97
-
98
-
99
-
100
-
101
-
102
-
103
-
104
-
105
-
106
-
107
-
108
-
109
-
110
-
111
-
112
-
113
-
 114
114 -
 115
115 -
 116
116 -
 117
117 -
 118
118 -
 119
119 -
 120
120 -
 121
121 -
 122
122 -
 123
123 -
 124
124 -
 125
125 -
 126
126 -
 127
127 -
 128
128 -
 129
129 -
 130
130 -
 131
131 -
 132
132 -
 133
133 -
 134
134 -
135
-
136
-
137
-
138
-
139
-
140
-
141
-
142
-
143
-
144
-
145
-
146
-
147
-
148
-
149
-
150
-
151
-
152
-
153
-
154
-
155
-
156
-
157
-
158
-
159
-
160
-
161
-
162
-
163
-
164
-
165
-
166
-
167
-
168
-
169
-
170
-
171
-
172
-
173
-
174
-
175
-
176
-
177
-
178
-
179
-
180
-
181
-
182
-
183
-
184
-
185
-
186
-
187
-
188
-
189
-
190
-
191
-
192
-
193
-
194
-
195
-
196
-
197
-
198
-
199
-
200
-
201
-
202
-
203
-
204
-
205
-
206
-
207
-
208
-
209
-
210
-
211
-
212
 |
 |

122
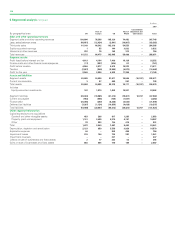
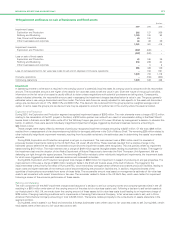
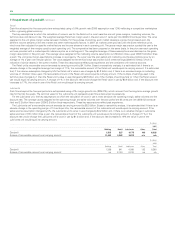
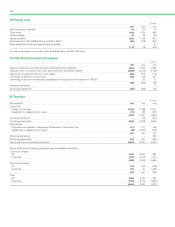
10 Impairment and losses on sale of businesses and fixed assets continued
Gas, Power and Renewables
There were no significant impairments in 2007.
The impairment charge for 2006 relates to certain North American pipeline assets. The trigger for impairment testing was the reduction in future
pipeline tariff revenues and increased ongoing operational costs.
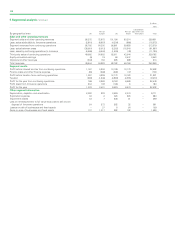
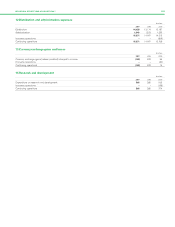
Other businesses and corporate
There were no significant impairments in 2007.
The impairment charge for 2006 relates to remaining chemical assets after the sale of Innovene. The impairment charge for 2005 relates to the
write-off of additional goodwill on the Solvay transactions.
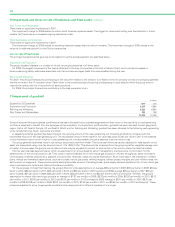
Loss on sale of fixed assets
The principal transactions that give rise to the losses for each business segment are described below.
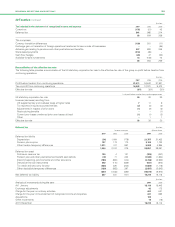
Exploration and Production
The group divested interests in a number of oil and natural gas properties in all three years.
For 2006, the largest component of the loss is attributed to the sale of properties in the Gulf of Mexico Shelf, which included increases in
decommissioning liability estimates associated with the hurricane-damaged fields that were divested during the year.
Refining and Marketing
For 2007, the principal transactions contributing to the loss were related to the decision to withdraw from the company-owned and company-operated
channel of trade in the US and retail churn. Retail churn is the overall process of acquiring and disposing of retail sites by which the group aims to
improve the quality and mix of its portfolio of service stations.
For 2006, the principal transactions contributing to the loss were retail churn.
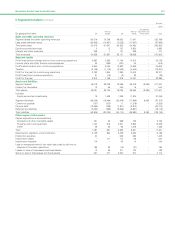
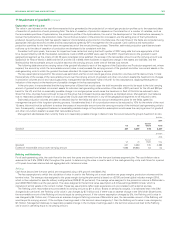
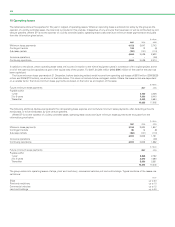
11 Impairment of goodwill
$ million
--------------------------------------------------------------------------------------------------------------------------------------------------------------------------------------------------------------------------------------------------------------------------------------------------------
Goodwill at 31 December 2007 2006
--------------------------------------------------------------------------------------------------------------------------------------------------------------------------------------------------------------------------------------------------------------------------------------------------------
Exploration and Production 4,247 4,282
Refining and Marketing 6,626 6,390
Gas, Power and Renewables 133 108
--------------------------------------------------------------------------------------------------------------------------------------------------------------------------------------------------------------------------------------------------------------------------------------------------------
11,006 10,780
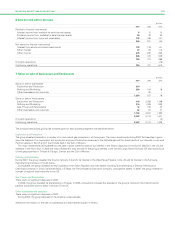
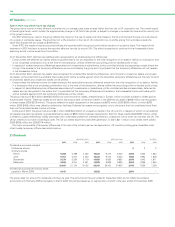
Goodwill acquired through business combinations has been allocated first to business segments and then down to the next level of cash-generating
unit that is expected to benefit from the synergies of the acquisition. For Exploration and Production, goodwill has been allocated to each geographic
region, that is UK, Rest of Europe, US and Rest of World, and for Refining and Marketing, goodwill has been allocated to the following cash-generating
units, namely Refining, Retail, Lubricants and Other.
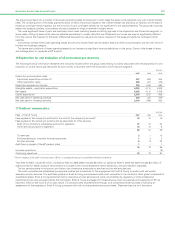
In assessing whether goodwill has been impaired, the carrying amount of the cash-generating unit (including goodwill) is compared with the
recoverable amount of the cash-generating unit. The recoverable amount is the higher of fair value less costs to sell and value in use. In the absence
of any information about the fair value of a cash-generating unit, the recoverable amount is deemed to be the value in use.
The group generally estimates value in use using a discounted cash flow model. The future cash flows are usually adjusted for risks specific to the
asset and discounted using a pre-tax discount rate of 11% (2006 10%). This discount rate is derived from the group’s post-tax weighted average cost
of capital. In some cases the group’s pre-tax discount rate may be adjusted to account for political risk in the country where the asset is located.
The five year business segment plans, which are approved on an annual basis by senior management, are the source of information for the
determination of the various values in use. They contain implicit forecasts for oil and natural gas production, refinery throughputs, sales volumes for
various types of refined products (e.g. gasoline and lubricants), revenues, costs and capital expenditure. As an initial step in the preparation of these
plans, various environmental assumptions, such as oil prices, natural gas prices, refining margins, refined product margins and cost inflation rates, are
set by senior management. These environmental assumptions take account of existing prices, global supply-demand equilibrium for oil and natural gas,
other macroeconomic factors and historical trends and variability.
For the purposes of impairment testing, the group’s Brent oil price assumption is an average $90 per barrel in 2008, $86 per barrel in 2009, $84 per
barrel in 2010, $84 per barrel in 2011, $84 per barrel in 2012 and $60 per barrel in 2013 and beyond (2006 average $65 per barrel in 2007, $68 per
barrel in 2008, $67 per barrel in 2009, $66 per barrel in 2010, $64 per barrel in 2011 and $40 per barrel in 2012 and beyond). Similarly, the group’s
assumption for Henry Hub natural gas prices is an average of $7.87 per mmBtu in 2008, $8.33 per mmBtu in 2009, $8.26 per mmBtu in 2010, $8.12
per mmBtu in 2011, $8.00 per mmBtu in 2012 and $7.50 per mmBtu in 2013 and beyond (2006 average of $8.10 per mmBtu in 2007, $8.31 per
mmBtu in 2008, $7.88 per mmBtu in 2009, $8.21 per mmBtu in 2010, $7.50 per mmBtu in 2011 and $5.50 per mmBtu in 2012 and beyond). These
prices are adjusted to arrive at appropriate consistent price assumptions for different qualities of oil and gas.