BP 2007 Annual Report Download - page 35
Download and view the complete annual report
Please find page 35 of the 2007 BP annual report below. You can navigate through the pages in the report by either clicking on the pages listed below, or by using the keyword search tool below to find specific information within the annual report.-
 1
1 -
2
-
3
-
4
-
5
-
6
-
7
-
8
-
9
-
10
-
11
-
12
-
13
-
14
-
15
-
16
-
17
-
18
-
19
-
20
-
21
-
22
-
23
-
24
-
 25
25 -
 26
26 -
 27
27 -
 28
28 -
 29
29 -
 30
30 -
 31
31 -
 32
32 -
 33
33 -
 34
34 -
 35
35 -
 36
36 -
 37
37 -
 38
38 -
 39
39 -
 40
40 -
 41
41 -
 42
42 -
 43
43 -
 44
44 -
 45
45 -
46
-
47
-
48
-
49
-
50
-
51
-
52
-
53
-
54
-
55
-
56
-
57
-
58
-
59
-
60
-
61
-
62
-
63
-
64
-
65
-
66
-
67
-
68
-
69
-
70
-
71
-
72
-
73
-
74
-
75
-
76
-
77
-
78
-
79
-
80
-
81
-
82
-
83
-
84
-
85
-
86
-
87
-
88
-
89
-
90
-
91
-
92
-
93
-
94
-
95
-
96
-
97
-
98
-
99
-
100
-
101
-
102
-
103
-
104
-
105
-
106
-
107
-
108
-
109
-
110
-
111
-
112
-
113
-
114
-
115
-
116
-
117
-
118
-
119
-
120
-
121
-
122
-
123
-
124
-
125
-
126
-
127
-
128
-
129
-
130
-
131
-
132
-
133
-
134
-
135
-
136
-
137
-
138
-
139
-
140
-
141
-
142
-
143
-
144
-
145
-
146
-
147
-
148
-
149
-
150
-
151
-
152
-
153
-
154
-
155
-
156
-
157
-
158
-
159
-
160
-
161
-
162
-
163
-
164
-
165
-
166
-
167
-
168
-
169
-
170
-
171
-
172
-
173
-
174
-
175
-
176
-
177
-
178
-
179
-
180
-
181
-
182
-
183
-
184
-
185
-
186
-
187
-
188
-
189
-
190
-
191
-
192
-
193
-
194
-
195
-
196
-
197
-
198
-
199
-
200
-
201
-
202
-
203
-
204
-
205
-
206
-
207
-
208
-
209
-
210
-
211
-
212
 |
 |

BP ANNUAL REPORT AND ACCOUNTS 2007 33
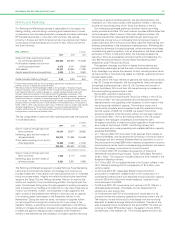
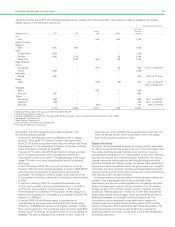
The following table shows BP’s Aromatics & Acetyls production capacity at 31 December 2007. This production capacity is based on the original
design capacity of the plants plus expansions.
thousand tonnes per year
--------------------------------------------------------------------------------------------------------------------------------------------------------------------------------------------------------------------------------------------------------------------------------------------------------
Total – BP
Acetic share of
Geographic area PTA PX acid Other capacity
--------------------------------------------------------------------------------------------------------------------------------------------------------------------------------------------------------------------------------------------------------------------------------------------------------
UK
Hull – – 549 616 1,165
Rest of Europe
Belgium
Geel 1,075 597 – – 1,672
USA
Cooper River 1,309 – – – 1,309
Decatur 1,046 1,109 – 29 2,184
Texas City – 1,302 550a123 1,975
Rest of World
China
Chongqing – – 211b52 263 (51% of YARACO)b
Zhuhai 1,496c– – – 1,496c
Indonesia
Merak 255 – – – 255 (50% of PT Ami)
Korea
Ulsan – – 245d59e304 (51% of SS-BP)d
(34% of ASACCO)e
Malaysia
Kertih – – 549 – 549
Kuantan 697 – – – 697
Taiwan
Kaohsiung 832f– – – 832 (61% of CAPCO)f
Taichung 469f– – – 469 (61% of CAPCO)f
Mai Liao – – 167g– 167 (50% of FBPC)g
--------------------------------------------------------------------------------------------------------------------------------------------------------------------------------------------------------------------------------------------------------------------------------------------------------
7,179 3,008 2,271 879 13,337
aSterling Chemicals plant, the output of which is marketed by BP.
bYangtze River Acetyls Company.
cInclusive of 900ktepa capacity from the second BP Zhuhai PTA plant, which commenced commissioning at end of 2007.
dSamsung-BP Chemicals Ltd.
eAsian Acetyls Company Ltd.
fChina American Petrochemical Company Ltd.
gFormosa BP Chemicals Corporation.
During 2007, the following significant activities took place in the
Aromatics & Acetyls business:
– Construction commenced on the new 500ktepa plant, in Jiangsu
province, China, by BP YPC Acetyls Company (Nanjing) Limited
(BYACO), BP’s 50% equity-share acetic acid joint venture with Yangzi
Petrochemical Co. Ltd (a subsidiary of Sinopec Corporation in China),
and is scheduled to complete by mid-2009.
– The second PTA plant at the BP Zhuhai Chemical Company Limited
site in Guangdong province, China, successfully commenced
commissioning at the end of 2007. The 900ktepa plant is the single
largest PTA train in the world, employing the latest BP proprietary
technology.
– In the first quarter of 2007, BP announced its intention to sell its
European VAM and ethyl acetate businesses. In January 2008, INEOS
announced that it had reached an agreement to acquire these
businesses. The transaction, which is subject to the approval of the
EU competition authorities, is expected to complete in the first quarter
of 2008.
– In the fourth quarter of 2007, BP completed the disposal of its
47.41% equity interest in Samsung Petrochemical Co. Ltd (SPC) to
our PTA joint venture partner, Samsung Group, in South Korea.
– The development of a 350ktepa PTA expansion at Geel, Belgium, is
expected to be operational in mid-2008 and to increase the site’s PTA
capacity to 1,425ktepa.
– In January 2008, BP and Sinopec signed a memorandum of
understanding to add a new acetic acid plant at their Yangtze River
Acetyls Co. (YARACO) joint venture in Chongqing, upstream Yangtze
River, south-west China. This world-scale acetic acid plant, using BP’s
leading Cativa
2
technology, is expected to have an annual capacity of
650ktepa. The plant is expected to be onstream in 2011, when the
total production at the YARACO site is expected to be well over one
million tonnes per annum, which would make it one of the largest
acetic acid production locations in China.
Supply and trading
The group has a long-established supply and trading activity responsible
for delivering value across the overall crude and oil products supply chain.
This activity identifies the best markets and prices for our crude oil,
sources optimal feedstock for our refining assets and sources marketing
activities with flexible and competitive supply. Additionally, the function
creates incremental trading opportunities through holding commodity
derivative contracts and trading inventory. To achieve these objectives in
a liquid and volatile international market, the group enters into a range of
commodity derivative contracts, including exchange-traded futures and
options, over-the-counter (OTC) options, swaps and forward contracts as
well as physical term and spot contracts.
Exchange-traded contracts are traded on liquid regulated markets that
transact in key crude grades, such as Brent and West Texas
Intermediate, and the main product grades, such as gasoline and gasoil.
These exchanges exist in each of the key markets in the US, western
Europe and Asia. OTC contracts include a variety of options, forwards
and swaps. These swaps price in relation to a wider set of grades than
those traded through the exchanges, where counterparties contract for
differences between, for example, fixed and floating prices. The
contracts we use are described in more detail below. Additionally,
physical crude can be traded forward by using specific OTC contracts
pricing in reference to Brent and West Texas Intermediate grades. OTC
crude forward sales contracts are used by BP to buy and sell the
underlying physical commodity, as well as to act as a risk management
and trading instrument.