BP 2007 Annual Report Download - page 122
Download and view the complete annual report
Please find page 122 of the 2007 BP annual report below. You can navigate through the pages in the report by either clicking on the pages listed below, or by using the keyword search tool below to find specific information within the annual report.-
 1
1 -
2
-
3
-
4
-
5
-
6
-
7
-
8
-
9
-
10
-
11
-
12
-
13
-
14
-
15
-
16
-
17
-
18
-
19
-
20
-
21
-
22
-
23
-
24
-
25
-
26
-
27
-
28
-
29
-
30
-
31
-
32
-
33
-
34
-
35
-
36
-
37
-
38
-
39
-
40
-
41
-
42
-
43
-
44
-
45
-
46
-
47
-
48
-
49
-
50
-
51
-
52
-
53
-
54
-
55
-
56
-
57
-
58
-
59
-
60
-
61
-
62
-
63
-
64
-
65
-
66
-
67
-
68
-
69
-
70
-
71
-
72
-
73
-
74
-
75
-
76
-
77
-
78
-
79
-
80
-
81
-
82
-
83
-
84
-
85
-
86
-
87
-
88
-
89
-
90
-
91
-
92
-
93
-
94
-
95
-
96
-
97
-
98
-
99
-
100
-
101
-
102
-
103
-
104
-
105
-
106
-
107
-
108
-
109
-
110
-
111
-
 112
112 -
 113
113 -
 114
114 -
 115
115 -
 116
116 -
 117
117 -
 118
118 -
 119
119 -
 120
120 -
 121
121 -
 122
122 -
 123
123 -
 124
124 -
 125
125 -
 126
126 -
 127
127 -
 128
128 -
 129
129 -
 130
130 -
 131
131 -
 132
132 -
133
-
134
-
135
-
136
-
137
-
138
-
139
-
140
-
141
-
142
-
143
-
144
-
145
-
146
-
147
-
148
-
149
-
150
-
151
-
152
-
153
-
154
-
155
-
156
-
157
-
158
-
159
-
160
-
161
-
162
-
163
-
164
-
165
-
166
-
167
-
168
-
169
-
170
-
171
-
172
-
173
-
174
-
175
-
176
-
177
-
178
-
179
-
180
-
181
-
182
-
183
-
184
-
185
-
186
-
187
-
188
-
189
-
190
-
191
-
192
-
193
-
194
-
195
-
196
-
197
-
198
-
199
-
200
-
201
-
202
-
203
-
204
-
205
-
206
-
207
-
208
-
209
-
210
-
211
-
212
 |
 |

120
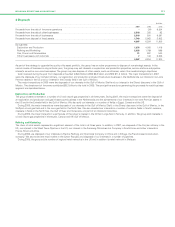
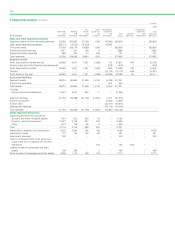
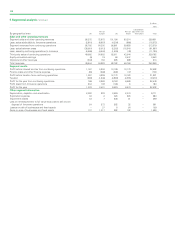
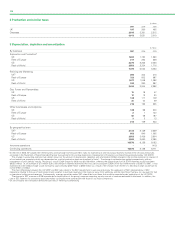
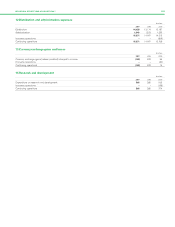
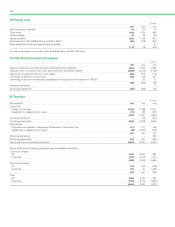
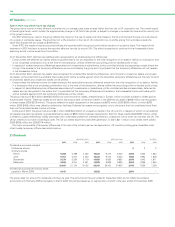
8 Production and similar taxes
$ million
--------------------------------------------------------------------------------------------------------------------------------------------------------------------------------------------------------------------------------------------------------------------------------------------------------
2007 2006 2005
--------------------------------------------------------------------------------------------------------------------------------------------------------------------------------------------------------------------------------------------------------------------------------------------------------
UK 197 260 495
Overseas 3,816 3,361 2,515
--------------------------------------------------------------------------------------------------------------------------------------------------------------------------------------------------------------------------------------------------------------------------------------------------------
4,013 3,621 3,010
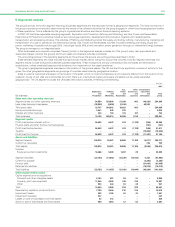
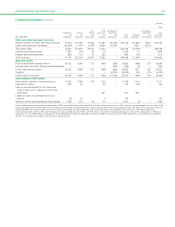
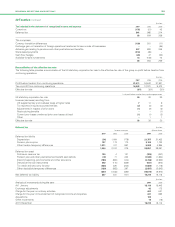
9 Depreciation, depletion and amortization
$ million
--------------------------------------------------------------------------------------------------------------------------------------------------------------------------------------------------------------------------------------------------------------------------------------------------------
By business 2007 2006 2005
--------------------------------------------------------------------------------------------------------------------------------------------------------------------------------------------------------------------------------------------------------------------------------------------------------
Exploration and Productiona
UK 1,683 1,720 1,663
Rest of Europe 211 223 228
US 2,273 2,236 2,426
Rest of World 3,553 2,354 1,716
--------------------------------------------------------------------------------------------------------------------------------------------------------------------------------------------------------------------------------------------------------------------------------------------------------
7,720 6,533 6,033
--------------------------------------------------------------------------------------------------------------------------------------------------------------------------------------------------------------------------------------------------------------------------------------------------------
Refining and Marketing
UKb286 303 316
Rest of Europe 729 603 687
US 1,077 1,048 1,082
Rest of World 338 290 297
--------------------------------------------------------------------------------------------------------------------------------------------------------------------------------------------------------------------------------------------------------------------------------------------------------
2,430 2,244 2,382
--------------------------------------------------------------------------------------------------------------------------------------------------------------------------------------------------------------------------------------------------------------------------------------------------------
Gas, Power and Renewables
UK 15 18 47
Rest of Europe 17 13 20
US 148 117 109
Rest of World 35 44 59
--------------------------------------------------------------------------------------------------------------------------------------------------------------------------------------------------------------------------------------------------------------------------------------------------------
215 192 235
--------------------------------------------------------------------------------------------------------------------------------------------------------------------------------------------------------------------------------------------------------------------------------------------------------
Other businesses and corporate
UK 149 98 203
Rest of Europe 21
US 60 58 187
Rest of World 32
--------------------------------------------------------------------------------------------------------------------------------------------------------------------------------------------------------------------------------------------------------------------------------------------------------
214 159 533
By geographical area
--------------------------------------------------------------------------------------------------------------------------------------------------------------------------------------------------------------------------------------------------------------------------------------------------------
UKb2,133 2,139 2,229
Rest of Europe 959 840 1,065
US 3,558 3,459 3,804
Rest of World 3,929 2,690 2,085
--------------------------------------------------------------------------------------------------------------------------------------------------------------------------------------------------------------------------------------------------------------------------------------------------------
10,579 9,128 9,183
--------------------------------------------------------------------------------------------------------------------------------------------------------------------------------------------------------------------------------------------------------------------------------------------------------
Innovene operations –– (412)
--------------------------------------------------------------------------------------------------------------------------------------------------------------------------------------------------------------------------------------------------------------------------------------------------------
Continuing operations 10,579 9,128 8,771
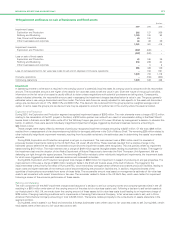
aAt the end of 2006, BP adopted the US Securities and Exchange Commission (SEC) rules for estimating oil and natural gas reserves instead of the UK accounting rules
contained in the Statement of Recommended Practice ‘Accounting for Oil and Gas Exploration, Development, Production and Decommissioning Activities’ (UK SORP).
This change in accounting estimate had a direct impact on the amount of depreciation, depletion and amortization (DD&A) charged in the income statement in respect of
oil and natural gas properties which are depreciated on a unit-of-production basis as described in Note 1. The change in estimate was applied prospectively, with no
restatement of prior periods’ results. The group’s actual DD&A charge for 2006 was $9,128 million, whereas the charge based on UK SORP reserves would have been
$9,057 million, i.e. an increase of $71 million due to the change in reserves estimates that was used to calculate DD&A for the last three months of 2006. For 2007, it was
estimated that the DD&A charge would increase by approximately $400 million to $500 million as a result of the change. Over the life of a field this change would have no
overall effect on DD&A.
The main differences between the UK SORP and SEC rules relate to the SEC requirement to use year-end prices, the application of SEC interpretations of SEC
regulations relating to the use of technology (mainly seismic) to estimate reserves in the reservoir away from wellbores and the reporting of fuel gas (i.e. gas used for fuel
in operations) within proved reserves. Consequently, reserves quantities under SEC rules differ from those that would be reported under application of the UK SORP.
The change to SEC reserves in 2006 represented a simplification of the group’s reserves reporting, as only one set of reserves estimates is disclosed. In addition, the
use of SEC reserves for accounting purposes makes our results more comparable with those of our major competitors.
bUK area includes the UK-based international activities of Refining and Marketing.
130
1
3