BP 2007 Annual Report Download - page 140
Download and view the complete annual report
Please find page 140 of the 2007 BP annual report below. You can navigate through the pages in the report by either clicking on the pages listed below, or by using the keyword search tool below to find specific information within the annual report.-
 1
1 -
2
-
3
-
4
-
5
-
6
-
7
-
8
-
9
-
10
-
11
-
12
-
13
-
14
-
15
-
16
-
17
-
18
-
19
-
20
-
21
-
22
-
23
-
24
-
25
-
26
-
27
-
28
-
29
-
30
-
31
-
32
-
33
-
34
-
35
-
36
-
37
-
38
-
39
-
40
-
41
-
42
-
43
-
44
-
45
-
46
-
47
-
48
-
49
-
50
-
51
-
52
-
53
-
54
-
55
-
56
-
57
-
58
-
59
-
60
-
61
-
62
-
63
-
64
-
65
-
66
-
67
-
68
-
69
-
70
-
71
-
72
-
73
-
74
-
75
-
76
-
77
-
78
-
79
-
80
-
81
-
82
-
83
-
84
-
85
-
86
-
87
-
88
-
89
-
90
-
91
-
92
-
93
-
94
-
95
-
96
-
97
-
98
-
99
-
100
-
101
-
102
-
103
-
104
-
105
-
106
-
107
-
108
-
109
-
110
-
111
-
112
-
113
-
114
-
115
-
116
-
117
-
118
-
119
-
120
-
121
-
122
-
123
-
124
-
125
-
126
-
127
-
128
-
129
-
 130
130 -
 131
131 -
 132
132 -
 133
133 -
 134
134 -
 135
135 -
 136
136 -
 137
137 -
 138
138 -
 139
139 -
 140
140 -
 141
141 -
 142
142 -
 143
143 -
 144
144 -
 145
145 -
 146
146 -
 147
147 -
 148
148 -
 149
149 -
 150
150 -
151
-
152
-
153
-
154
-
155
-
156
-
157
-
158
-
159
-
160
-
161
-
162
-
163
-
164
-
165
-
166
-
167
-
168
-
169
-
170
-
171
-
172
-
173
-
174
-
175
-
176
-
177
-
178
-
179
-
180
-
181
-
182
-
183
-
184
-
185
-
186
-
187
-
188
-
189
-
190
-
191
-
192
-
193
-
194
-
195
-
196
-
197
-
198
-
199
-
200
-
201
-
202
-
203
-
204
-
205
-
206
-
207
-
208
-
209
-
210
-
211
-
212
 |
 |

138
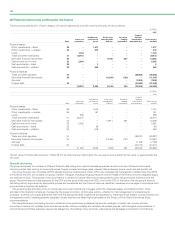
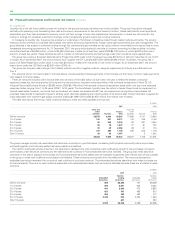
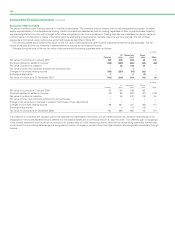
28 Financial instruments and financial risk factors continued
These sensitivities are hypothetical and should not be considered to be predictive of future performance. Changes in fair value generally cannot be
extrapolated because the relationship of change in assumption to change in fair value may not be linear. In addition, for the purposes of this analysis,
in this table, the effect of a variation in a particular assumption on the fair value of the embedded derivatives is calculated independently of any change
in another assumption. In reality, changes in one factor may contribute to changes in another, which may magnify or counteract the sensitivities.
Furthermore, the estimated fair values as disclosed should not be considered indicative of future earnings on these contracts.
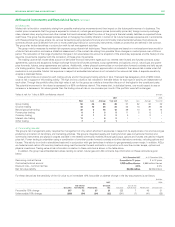
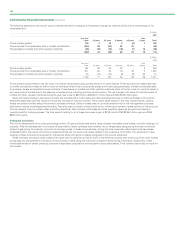
(ii) Foreign currency exchange risk
Where the group enters into foreign currency exchange contracts for entrepreneurial trading purposes the activity is controlled using trading value-at-
risk techniques as explained above. This activity is described as currency trading in the value at risk table above.
Since BP has global operations fluctuations in foreign currency exchange rates can have significant effects on the group’s reported results. The
effects of most exchange rate fluctuations are absorbed in business operating results through changing cost competitiveness, lags in market
adjustment to movements in rates and conversion differences accounted for on specific transactions. For this reason, the total effect of exchange rate
fluctuations is not identifiable separately in the group’s reported results. The main underlying economic currency of the group’s cash flows is the US
dollar. This is because BP’s major product, oil, is priced internationally in US dollars. BP’s foreign currency exchange management policy is to minimize
economic and material transactional exposures arising from currency movements against the US dollar. The group co-ordinates the handling of foreign
currency exchange risks centrally, by netting off naturally-occurring opposite exposures wherever possible, and then dealing with any material residual
foreign currency exchange risks.
The group manages these exposures by constantly reviewing the foreign currency economic value at risk and managing such risk to keep the 12-
month foreign currency value at risk below $200 million. At 31 December 2007, the foreign currency value at risk was $60 million (2006 $107 million).
At no point over the past two years did the value at risk exceed the maximum risk limit. The most significant exposures relate to capital expenditure
commitments and other UK and European operational requirements, for which a hedging programme is in place and hedge accounting is claimed as
outlined in Note 34.
For highly probable forecast capital expenditures the group locks in the US-dollar cost of non-US dollar supplies by using currency futures. The main
exposures are sterling and euro, and at 31 December 2007 open contracts were in place for $732 million sterling and $931 million euro capital
expenditures, with over 80% of the deals maturing within two years (2006 $630 million sterling and $957 million euro capital expenditures with over
95% of the deals maturing within two years).
For other UK and European operational requirements the group predominantly uses cylinders to hedge the estimated exposures on a 12-month
rolling basis at minimal cost. At 31 December 2007, the main open positions consisted of receive sterling, pay US dollar, purchased call and sold put
options for $2,800 million; and receive euro, pay US dollar cylinders for $1,400 million.
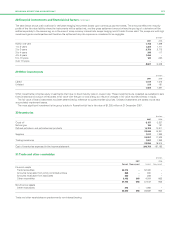
In addition, most of the group’s borrowings are in US dollars or are hedged with respect to the US dollar. At 31 December 2007, the total of foreign
currency borrowings not swapped into US dollars amounted to $1,045 million (2006 $957 million). Of this total, $268 million (2006 $300 million) of
these borrowings were denominated in currencies other than the functional currency of the individual operating unit, $191 million in Canadian dollars
and $77 million in Trinidad & Tobago dollars (2006 $224 million in Canadian dollars and $76 million in Trinidad & Tobago dollars). It is estimated that a
10% change in the corresponding exchange rates would result in an exchange gain or loss in the income statement of $27 million (2006 $30 million).
(iii) Interest rate risk
Where the group enters into money market contracts for entrepreneurial trading purposes the activity is controlled using value-at-risk techniques as
described above. This activity is described as interest rate trading in the value at risk table above.
BP is also exposed to interest rate risk from the possibility that changes in interest rates will affect future cash flows or the fair values of its financial
instruments, principally finance debt. While the group issues debt in a variety of currencies based on market opportunities, it uses derivatives to swap
the debt to a US dollar exposure with an overall profile of one-third fixed rate to two-thirds floating rate. The proportion of floating rate debt net of
interest rate swaps at 31 December 2007 was 68% of total finance debt outstanding (2006 73%). The weighted average interest rate on finance debt
is 5% (2006 5%).
The group’s earnings are sensitive to changes in interest rates on the floating rate element of the group’s finance debt. If the interest rates
applicable to floating rate instruments were to have increased by 1% on 1 January 2008, it is estimated that the group’s profit before taxation for
2008 would decrease by approximately $168 million (2006 $180 million). This assumes that the amount and mix of fixed and floating rate debt,
including finance leases, remains unchanged from that in place at 31 December 2007 and that the change in interest rates is effective from the
beginning of the year. Where the interest rate applicable to an instrument is reset during a quarter it is assumed that this occurs at the beginning of
the quarter and remains unchanged for the rest of the year. In reality, the fixed/floating rate mix will fluctuate over the year and interest rates will
change continually. Furthermore, the effect on earnings shown by this analysis does not consider the effect of an overall reduction in economic activity
that could accompany such an increase in interest rates.
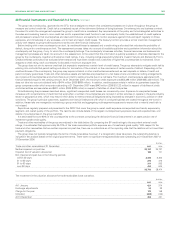
(iv) Equity price risk
The group holds equity investments that are classified as non-current available-for-sale financial assets and are measured initially at fair value with
changes in fair value recognized directly in equity. On disposal, accumulated fair value changes are recycled to the income statement. Such
investments are typically made for strategic purposes. At 31 December 2007, it is estimated that a change of 10% in equity prices would result in an
immediate charge or credit to equity of $162 million (2006 $152 million).
At 31 December 2007, 70% of the carrying amount of non-current available-for-sale financial assets represented one equity investment, thus the
group’s exposure is concentrated on changes in the share prices of this equity in particular. For further information see Note 29.
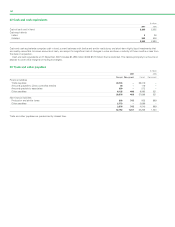
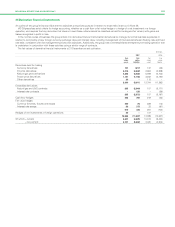
(b) Credit risk
Credit risk is the risk that a customer or counterparty to a financial instrument will fail to perform or fail to pay amounts due causing financial loss to
the group and arises from cash and cash equivalents, derivative financial instruments and deposits with financial institutions and principally from credit
exposures to customers relating to outstanding receivables.