BP 2007 Annual Report Download - page 18
Download and view the complete annual report
Please find page 18 of the 2007 BP annual report below. You can navigate through the pages in the report by either clicking on the pages listed below, or by using the keyword search tool below to find specific information within the annual report.-
 1
1 -
2
-
3
-
4
-
5
-
6
-
7
-
 8
8 -
 9
9 -
 10
10 -
 11
11 -
 12
12 -
 13
13 -
 14
14 -
 15
15 -
 16
16 -
 17
17 -
 18
18 -
 19
19 -
 20
20 -
 21
21 -
 22
22 -
 23
23 -
 24
24 -
 25
25 -
 26
26 -
 27
27 -
 28
28 -
29
-
30
-
31
-
32
-
33
-
34
-
35
-
36
-
37
-
38
-
39
-
40
-
41
-
42
-
43
-
44
-
45
-
46
-
47
-
48
-
49
-
50
-
51
-
52
-
53
-
54
-
55
-
56
-
57
-
58
-
59
-
60
-
61
-
62
-
63
-
64
-
65
-
66
-
67
-
68
-
69
-
70
-
71
-
72
-
73
-
74
-
75
-
76
-
77
-
78
-
79
-
80
-
81
-
82
-
83
-
84
-
85
-
86
-
87
-
88
-
89
-
90
-
91
-
92
-
93
-
94
-
95
-
96
-
97
-
98
-
99
-
100
-
101
-
102
-
103
-
104
-
105
-
106
-
107
-
108
-
109
-
110
-
111
-
112
-
113
-
114
-
115
-
116
-
117
-
118
-
119
-
120
-
121
-
122
-
123
-
124
-
125
-
126
-
127
-
128
-
129
-
130
-
131
-
132
-
133
-
134
-
135
-
136
-
137
-
138
-
139
-
140
-
141
-
142
-
143
-
144
-
145
-
146
-
147
-
148
-
149
-
150
-
151
-
152
-
153
-
154
-
155
-
156
-
157
-
158
-
159
-
160
-
161
-
162
-
163
-
164
-
165
-
166
-
167
-
168
-
169
-
170
-
171
-
172
-
173
-
174
-
175
-
176
-
177
-
178
-
179
-
180
-
181
-
182
-
183
-
184
-
185
-
186
-
187
-
188
-
189
-
190
-
191
-
192
-
193
-
194
-
195
-
196
-
197
-
198
-
199
-
200
-
201
-
202
-
203
-
204
-
205
-
206
-
207
-
208
-
209
-
210
-
211
-
212
 |
 |

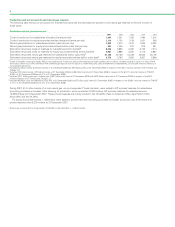
Reserve replacement
Total hydrocarbon proved reserves, on an oil equivalent basis and
excluding equity-accounted entities, comprised 12,583mmboe at
31 December 2007, a decrease of 4.4% compared with 31 December
2006. Natural gas represents about 56% of these reserves. The
reduction includes net sales of 58mmboe, largely comprising a number
of assets in the Netherlands, Pakistan, Canada and the US.
Total hydrocarbon proved reserves, on an oil equivalent basis for
equity-accounted entities alone, comprised 5,231mmboe at 31 December
2007, an increase of 15.3% compared with 31 December 2006. Natural
gas represents about 12% of these proved reserves. The increase
includes net sales of 3mmboe, largely comprising a number of assets in
Russia.
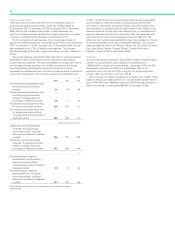
The proved reserves replacement ratio (also known as the production
replacement ratio) is the extent to which production is replaced by
proved reserves additions. This ratio is expressed in oil equivalent terms
and includes changes resulting from revisions to previous estimates,
improved recovery and extensions and discoveries, and may be
expressed as a replacement ratio excluding acquisitions and divestments
or as a total replacement ratio including acquisitions and divestments.
%
------------------------------------------------------------------------------------------------------------------------------------------------
2007 2006 2005
------------------------------------------------------------------------------------------------------------------------------------------------
Proved reserves replacement ratio,
excluding equity-accounted
entities 44 34 68
Proved reserves replacement ratio,
excluding equity-accounted
entities, including sales and
purchases of reserves-in-place 38 11 40
Proved reserves replacement ratio,
for equity-accounted entities 248 272 151
Proved reserves replacement ratio,
for equity-accounted entities,
including sales and purchases of
reserves-in-place 248 239 141
million barrels of oil equivalent
------------------------------------------------------------------------------------------------------------------------------------------------
Additions to proved developed
reserves, excluding equity-
accounted entities, including
sales and purchases of reserves-
in-placea929 675 632
Additions to proved developed
reserves, for equity-accounted
entities, including sales and
purchases of reserves-in-placea473 936 474
%
------------------------------------------------------------------------------------------------------------------------------------------------
Proved developed reserves
replacement ratio, excluding
equity-accounted entities,
including sales and purchases of
reserves-in-place 99 70 63
Proved developed reserves
replacement ratio, for equity-
accounted entities, including
sales and purchases of reserves-
in-place 101 195 99
aThis includes some reserves that were previously classified as proved
undeveloped.
In 2007, net additions to the group’s proved reserves (excluding sales
and purchases of reserves-in-place and equity-accounted entities)
amounted to 414mmboe, principally through improved recovery from,
and extensions to, existing fields and discoveries of new fields. Of the
reserves additions through improved recovery from, and extensions to,
existing fields and discoveries of new fields, 64% are associated with
new projects and are proved undeveloped reserves additions. The
remainder are in existing developments where they represent a mixture
of proved developed and proved undeveloped reserves. The principal
reserves additions were in the Norway (Skarv), the US (Liberty, Prudhoe
Bay, Great White, Nakika, Thunder Horse), Trinidad (Immortelle,
Manakin), Angola (Pazflor) and Canada (Noel).
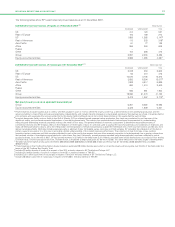
Production
Our total hydrocarbon production during 2007 averaged 2,549 thousand
barrels of oil equivalent per day (mboe/d) for subsidiaries and
1,269mboe/d for equity-accounted entities, a decrease of 3% and 2%
respectively compared with 2006. For subsidiaries, 35% of our
production was in the US and 13% in the UK. For equity-accounted
entities, 72% of production was from TNK-BP.
Total production for 2008 is expected to be higher than in 2007. This is
based on the group’s asset portfolio at 1 January 2008, expected start-
ups in 2008 and Brent at $60/bbl, before any 2008 disposal effects and
before any effects of prices above $60/bbl on volumes in PSAs.
16