BP 2007 Annual Report Download - page 32
Download and view the complete annual report
Please find page 32 of the 2007 BP annual report below. You can navigate through the pages in the report by either clicking on the pages listed below, or by using the keyword search tool below to find specific information within the annual report.-
 1
1 -
2
-
3
-
4
-
5
-
6
-
7
-
8
-
9
-
10
-
11
-
12
-
13
-
14
-
15
-
16
-
17
-
18
-
19
-
20
-
21
-
 22
22 -
 23
23 -
 24
24 -
 25
25 -
 26
26 -
 27
27 -
 28
28 -
 29
29 -
 30
30 -
 31
31 -
 32
32 -
 33
33 -
 34
34 -
 35
35 -
 36
36 -
 37
37 -
 38
38 -
 39
39 -
 40
40 -
 41
41 -
 42
42 -
43
-
44
-
45
-
46
-
47
-
48
-
49
-
50
-
51
-
52
-
53
-
54
-
55
-
56
-
57
-
58
-
59
-
60
-
61
-
62
-
63
-
64
-
65
-
66
-
67
-
68
-
69
-
70
-
71
-
72
-
73
-
74
-
75
-
76
-
77
-
78
-
79
-
80
-
81
-
82
-
83
-
84
-
85
-
86
-
87
-
88
-
89
-
90
-
91
-
92
-
93
-
94
-
95
-
96
-
97
-
98
-
99
-
100
-
101
-
102
-
103
-
104
-
105
-
106
-
107
-
108
-
109
-
110
-
111
-
112
-
113
-
114
-
115
-
116
-
117
-
118
-
119
-
120
-
121
-
122
-
123
-
124
-
125
-
126
-
127
-
128
-
129
-
130
-
131
-
132
-
133
-
134
-
135
-
136
-
137
-
138
-
139
-
140
-
141
-
142
-
143
-
144
-
145
-
146
-
147
-
148
-
149
-
150
-
151
-
152
-
153
-
154
-
155
-
156
-
157
-
158
-
159
-
160
-
161
-
162
-
163
-
164
-
165
-
166
-
167
-
168
-
169
-
170
-
171
-
172
-
173
-
174
-
175
-
176
-
177
-
178
-
179
-
180
-
181
-
182
-
183
-
184
-
185
-
186
-
187
-
188
-
189
-
190
-
191
-
192
-
193
-
194
-
195
-
196
-
197
-
198
-
199
-
200
-
201
-
202
-
203
-
204
-
205
-
206
-
207
-
208
-
209
-
210
-
211
-
212
 |
 |

30
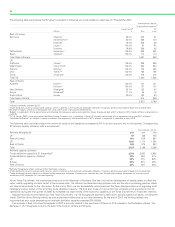
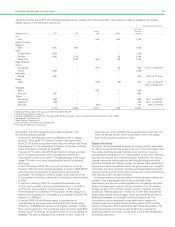
The following table summarizes the BP group’s interests in refineries and crude distillation capacities at 31 December 2007.
thousand barrels per day
--------------------------------------------------------------------------------------------------------------------------------------------------------------------------------------------------------------------------------------------------------------------------------------------------------
a
Crude distillation capacities
--------------------------------------------------------------------------------------------------------------------------------------------------------------------------------------------------------------------------------------------------------------------------------------------------------
b
Group interest BP
Refinery % Total share
--------------------------------------------------------------------------------------------------------------------------------------------------------------------------------------------------------------------------------------------------------------------------------------------------------
Rest of Europe
Germany Bayernoil 22.5% 272 61
Gelsenkirchen* 50.0% 268 134
Karlsruhe 12.0% 302 36
Lingen* 100.0% 91 91
Schwedt 18.8% 226 42
Netherlands Rotterdam* 100.0% 392 392
Spain Castello
´n* 100.0% 110 110
--------------------------------------------------------------------------------------------------------------------------------------------------------------------------------------------------------------------------------------------------------------------------------------------------------
Total Rest of Europe 1,661 866
US
California Carson* 100.0% 266 266
Washington Cherry Point* 100.0% 234 234
Indiana Whiting* 100.0% 405 405
Ohio Toledo*c100.0% 155 155
Texas Texas City* 100.0% 475 475
--------------------------------------------------------------------------------------------------------------------------------------------------------------------------------------------------------------------------------------------------------------------------------------------------------
Total US 1,535 1,535
Rest of World
Australia Bulwer* 100.0% 101 101
Kwinana* 100.0% 137 137
New Zealand Whangerei 23.7% 102 24
Kenya Mombasad17.1% 94 16
South Africa Durban 50.0% 180 90
--------------------------------------------------------------------------------------------------------------------------------------------------------------------------------------------------------------------------------------------------------------------------------------------------------
Total Rest of World 614 368
Total 3,810 2,769
*Indicates refineries operated by BP.
aCrude distillation capacity is gross rated capacity, which is defined as the maximum achievable utilization of capacity (24-hour assessment) based on standard feed.
bBP share of equity, which is not necessarily the same as BP share of processing entitlements.
cSubject to negotiation of final agreements and obtaining the necessary approval and permits, Husky Energy will take a 50% interest in BP’s Toledo refinery as described on
page 28.
dOn 15 January 2008, it was announced that Essar Energy Overseas Ltd, a subsidiary of Essar Oil Limited, had entered into an agreement to acquire 50% of Kenya
Petroleum Refineries Ltd. Subject to certain conditions, the acquisition, which includes all of BP’s interest, is expected to complete in early 2008.
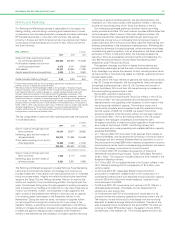
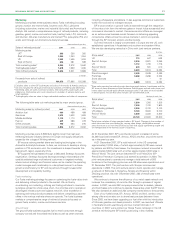
The following table outlines by region the volume of crude oil and feedstock processed by BP for its own account and for third parties. Corresponding
BP refinery capacity utilization data is summarized.
thousand barrels per day
--------------------------------------------------------------------------------------------------------------------------------------------------------------------------------------------------------------------------------------------------------------------------------------------------------
Refinery throughputsa2007 2006 2005
--------------------------------------------------------------------------------------------------------------------------------------------------------------------------------------------------------------------------------------------------------------------------------------------------------
UK 67 165 180
Rest of Europe 691 648 667
US 1,064 1,110 1,255
Rest of World 305 275 297
--------------------------------------------------------------------------------------------------------------------------------------------------------------------------------------------------------------------------------------------------------------------------------------------------------
Total 2,127 2,198 2,399
Refinery capacity utilization
Crude distillation capacity at 31 Decemberb2,769 2,823 2,832
Crude distillation capacity utilizationc72% 76% 87%
US 62% 70% 82%
Europe 84% 87% 90%
Rest of World 84% 78% 88%
aRefinery throughputs reflect crude and other feedstock volumes.
bCrude distillation capacity is gross rated capacity, which is defined as the maximum achievable utilization of capacity (24-hour assessment) based on standard feed.
cCrude distillation capacity utilization is defined as the percentage utilization of capacity per calendar day over the year after making allowances for average annual
shutdowns at BP refineries (i.e. net rated capacity).
At the Texas City refinery, the recommissioning work in the aftermath of Hurricane Rita has involved the development of detailed plans to effect the
repair, safety-upgrading and safe restart of the process units. The refinery has restarted many process units and the site is producing gasoline, diesel
and chemicals products for the US market. By the end of 2007, we had successfully recommissioned the three desulphurization and upgrading units
necessary to allow restart of the remaining crude distillation capacity. The final sour crude unit is mechanically complete and is expected to be fully
operational during the first quarter of 2008. By mid-2008 we expect most of the economic capability at the Texas City refinery to have been restored.
Despite the partial recommissioning of the Texas City refinery, our US throughputs declined in 2007 due to several operational issues, including the
March 2007 fire at the Whiting refinery as well as planned maintenance at our other refineries. By the end of 2007, the Whiting refinery had
recommenced sour crude processing and available distillation capacity exceeded 300,000b/d.
The increase in Rest of Europe throughputs in 2007 is primarily related to the purchase of Chevron’s 31% interest in the Rotterdam refinery. The
decrease in UK throughputs is due to the sale of the Coryton refinery to Petroplus.