BP 2007 Annual Report Download - page 29
Download and view the complete annual report
Please find page 29 of the 2007 BP annual report below. You can navigate through the pages in the report by either clicking on the pages listed below, or by using the keyword search tool below to find specific information within the annual report.-
 1
1 -
2
-
3
-
4
-
5
-
6
-
7
-
8
-
9
-
10
-
11
-
12
-
13
-
14
-
15
-
16
-
17
-
18
-
 19
19 -
 20
20 -
 21
21 -
 22
22 -
 23
23 -
 24
24 -
 25
25 -
 26
26 -
 27
27 -
 28
28 -
 29
29 -
 30
30 -
 31
31 -
 32
32 -
 33
33 -
 34
34 -
 35
35 -
 36
36 -
 37
37 -
 38
38 -
 39
39 -
40
-
41
-
42
-
43
-
44
-
45
-
46
-
47
-
48
-
49
-
50
-
51
-
52
-
53
-
54
-
55
-
56
-
57
-
58
-
59
-
60
-
61
-
62
-
63
-
64
-
65
-
66
-
67
-
68
-
69
-
70
-
71
-
72
-
73
-
74
-
75
-
76
-
77
-
78
-
79
-
80
-
81
-
82
-
83
-
84
-
85
-
86
-
87
-
88
-
89
-
90
-
91
-
92
-
93
-
94
-
95
-
96
-
97
-
98
-
99
-
100
-
101
-
102
-
103
-
104
-
105
-
106
-
107
-
108
-
109
-
110
-
111
-
112
-
113
-
114
-
115
-
116
-
117
-
118
-
119
-
120
-
121
-
122
-
123
-
124
-
125
-
126
-
127
-
128
-
129
-
130
-
131
-
132
-
133
-
134
-
135
-
136
-
137
-
138
-
139
-
140
-
141
-
142
-
143
-
144
-
145
-
146
-
147
-
148
-
149
-
150
-
151
-
152
-
153
-
154
-
155
-
156
-
157
-
158
-
159
-
160
-
161
-
162
-
163
-
164
-
165
-
166
-
167
-
168
-
169
-
170
-
171
-
172
-
173
-
174
-
175
-
176
-
177
-
178
-
179
-
180
-
181
-
182
-
183
-
184
-
185
-
186
-
187
-
188
-
189
-
190
-
191
-
192
-
193
-
194
-
195
-
196
-
197
-
198
-
199
-
200
-
201
-
202
-
203
-
204
-
205
-
206
-
207
-
208
-
209
-
210
-
211
-
212
 |
 |

BP ANNUAL REPORT AND ACCOUNTS 2007 27
Refining and Marketing
Our Refining and Marketing business is responsible for the supply and
trading, refining, manufacturing, marketing and transportation of crude
oil, petroleum and chemicals products to wholesale and retail customers.
BP markets its products in more than 100 countries. We operate
primarily in Europe and North America but also manufacture and market
our products across Australasia and in parts of Asia, Africa and Central
and South America.
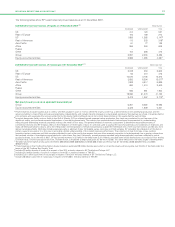
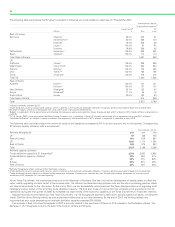
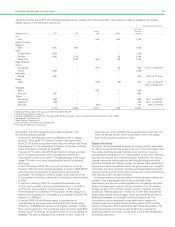
Key statistics $million
------------------------------------------------------------------------------------------------------------------------------------------------
2007 2006 2005
------------------------------------------------------------------------------------------------------------------------------------------------
Sales and other operating revenues
for continuing operations 250,866 232,855 213,326
Profit before interest and tax from
continuing operationsa6,072 5,041 6,926
Total assets 95,691 80,964 77,485
Capital expenditure and acquisitions 5,586 3,144 2,860
$ per barrel
------------------------------------------------------------------------------------------------------------------------------------------------
Global Indicator Refining Marginb9.94 8.39 8.60
aProfit before interest and tax from continuing operations includes profit after
interest and tax of equity-accounted entities.
bThe Global Indicator Refining Margin (GIM) is the average of regional industry
indicator margins, which we weight for BP’s crude refining capacity in each region.
Each regional indicator margin is based on a single representative crude with
product yields characteristic of the typical level of upgrading complexity. The
refining margins are industry-specific rather than BP-specific measures, which we
believe are useful to investors in analyzing trends in the industry and their impact
on our results. The margins are calculated by BP based on published crude oil and
product prices and take account of fuel utilization and catalyst costs. No account is
taken of BP’s other cash and non-cash costs of refining, such as wages and salaries
and plant depreciation. The indicator margin may not be representative of the
margins achieved by BP in any period because of BP’s particular refining
configurations and crude and product slate.
The key components of sales and other operating revenues are explained
in more detail below.
$million
------------------------------------------------------------------------------------------------------------------------------------------------
2007 2006 2005
------------------------------------------------------------------------------------------------------------------------------------------------
Sale of crude oil through spot and
term contracts 43,004 38,577 36,992
Marketing, spot and term sales of
refined products 194,979 177,995 155,098
Other sales including non-oil and to
other segments 12,883 16,283 21,236
------------------------------------------------------------------------------------------------------------------------------------------------
250,866 232,855 213,326
thousand barrels per day
------------------------------------------------------------------------------------------------------------------------------------------------
Sale of crude oil through spot and
term contracts 1,885 2,110 2,464
Marketing, spot and term sales of
refined products 5,624 5,801 5,888
The Refining and Marketing segment includes Refining, Fuels Marketing,
Lubricants and Aromatics & Acetyls. Our strategy is to continue our
focused investment in key assets and market positions with an increased
focus on process safety, integrity and reliability following the operational
issues at the Texas City and Whiting refineries. We aim to improve the
quality and capability of our manufacturing portfolio. During the past five
years, this has been taking place through upgrades of existing conversion
units at several of our facilities and investment in new clean fuels units at
most of our refineries. In 2007, we completed a major upgrade to the
olefin cracker at the Gelsenkirchen refinery in Germany and an upgrade
of an existing diesel hydrotreater at the Rotterdam refinery in the
Netherlands. During the next five years, we expect to upgrade further
our refining portfolio through the construction of a new coker at the
Castello
´n refinery, a planned and announced investment in the Whiting
refinery to increase its ability to process Canadian heavy crude, upgrades
to diesel and gasoline desulphurization capability at the Rotterdam
refinery in the Netherlands, the installation of modern naphtha reforming
technology at several refineries globally, the site reconfiguration and
installation of a new hydrocracker at the Bayernoil refinery in Germany
and the full recommissioning of the Texas City refinery in the US.
Our marketing businesses generate customer value by providing
quality products and offers. Our retail network provides differentiated fuel
and convenience offers to some of the most attractive markets. Our
lubricants brands offer customers benefits through technology and
relationships and we focus on increasing brand and product loyalty in
Castrol lubricants. We continue to build deep customer relationships and
strategic partnerships in the business-to-business sector. Marketing also
includes the Aromatics & Acetyls business, which maintains world-class
manufacturing positions globally, with an emphasis on the Asian market,
particularly in China. At the end of 2007, the business increased its
capacity in China by successfully commencing the commissioning of a
new 900 thousand tonnes per annum (ktepa) worldscale purified
terephthalic acid (PTA) plant at Zhuhai.
The segment manages a portfolio of assets that we believe are
competitively advantaged across the chain of downstream activities.
Such advantage may derive from several factors, including location (such
as the proximity of manufacturing assets to markets), operating cost and
physical asset quality.
We are one of the major refiners of gasoline and hydrocarbon products
in the US, Europe and Australia. We have significant retail and business-
to-business market positions in the US, UK, Germany and the rest of
Europe, Australasia, Africa and Asia. We are enhancing our presence in
China and exploring opportunities in India.
During 2007, significant events were:
– BP continued recommissioning the Texas City refinery in the US. By
the end of 2007, we had successfully recommissioned the three
desulphurization and upgrading units necessary to allow restart of the
remaining crude distillation capacity. The final sour crude unit is
mechanically complete and is expected to be fully operational during
the first quarter of 2008. By mid-2008, we expect most of the
economic capability at the Texas City refinery to have been restored.
– On 23 March 2007, a fire at the Whiting refinery in the US caused
damage to the hydrogen compressors and limited the site’s
throughput and ability to make low-sulphur gasoline or diesel fuel from
sour crude oil. By the end of 2007, the Whiting refinery had
recommenced sour crude processing and available distillation capacity
exceeded 300,000b/d.
– On 1 February 2007, BP announced it had selected the University of
California Berkeley, and its partners the University of Illinois at Urbana-
Champaign and the Lawrence Berkeley National Laboratory, to join in
the previously announced $500-million research programme to explore
how bioscience can be used to increase energy production and reduce
the impact of energy consumption on the environment.
– On 31 March 2007, BP completed its acquisition of Chevron’s
Netherlands manufacturing company, Texaco Raffinaderij Pernis B.V.,
for $1.1 billion. The acquisition included Chevron’s 31% interest in the
Rotterdam (Nerefco) refinery.
– On 31 May 2007, BP completed the sale of its Coryton refinery in the
UK to Petroplus Holdings AG for consideration of $1.4 billion, plus
working capital.
– On 26 June 2007, BP, Associated British Foods and DuPont
announced an investment of $400 million in the construction of a
world-scale bioethanol plant with expected annual production capacity
of some 420 million litres from wheat feedstock, expected to be
commissioned in late 2009.
– On 29 June 2007, BP announced a joint venture with D1 Oils plc, a
UK-based global producer of biodiesel, for the development of
jatropha as a new energy crop.
– On 15 November 2007, BP announced that it would sell all of its
company-owned and company-operated convenience sites in the US.
The majority of sites will be sold to franchisees with the remaining
sites sold to dealers and large distributors (jobbers). The sale of the
sites is expected to be completed by the end of 2009. The sites will
continue to market BP-branded fuels in the eastern US and ARCO-
branded fuels in the western US. The franchise agreement is for 20