BP 2007 Annual Report Download - page 136
Download and view the complete annual report
Please find page 136 of the 2007 BP annual report below. You can navigate through the pages in the report by either clicking on the pages listed below, or by using the keyword search tool below to find specific information within the annual report.-
 1
1 -
2
-
3
-
4
-
5
-
6
-
7
-
8
-
9
-
10
-
11
-
12
-
13
-
14
-
15
-
16
-
17
-
18
-
19
-
20
-
21
-
22
-
23
-
24
-
25
-
26
-
27
-
28
-
29
-
30
-
31
-
32
-
33
-
34
-
35
-
36
-
37
-
38
-
39
-
40
-
41
-
42
-
43
-
44
-
45
-
46
-
47
-
48
-
49
-
50
-
51
-
52
-
53
-
54
-
55
-
56
-
57
-
58
-
59
-
60
-
61
-
62
-
63
-
64
-
65
-
66
-
67
-
68
-
69
-
70
-
71
-
72
-
73
-
74
-
75
-
76
-
77
-
78
-
79
-
80
-
81
-
82
-
83
-
84
-
85
-
86
-
87
-
88
-
89
-
90
-
91
-
92
-
93
-
94
-
95
-
96
-
97
-
98
-
99
-
100
-
101
-
102
-
103
-
104
-
105
-
106
-
107
-
108
-
109
-
110
-
111
-
112
-
113
-
114
-
115
-
116
-
117
-
118
-
119
-
120
-
121
-
122
-
123
-
124
-
125
-
 126
126 -
 127
127 -
 128
128 -
 129
129 -
 130
130 -
 131
131 -
 132
132 -
 133
133 -
 134
134 -
 135
135 -
 136
136 -
 137
137 -
 138
138 -
 139
139 -
 140
140 -
 141
141 -
 142
142 -
 143
143 -
 144
144 -
 145
145 -
 146
146 -
147
-
148
-
149
-
150
-
151
-
152
-
153
-
154
-
155
-
156
-
157
-
158
-
159
-
160
-
161
-
162
-
163
-
164
-
165
-
166
-
167
-
168
-
169
-
170
-
171
-
172
-
173
-
174
-
175
-
176
-
177
-
178
-
179
-
180
-
181
-
182
-
183
-
184
-
185
-
186
-
187
-
188
-
189
-
190
-
191
-
192
-
193
-
194
-
195
-
196
-
197
-
198
-
199
-
200
-
201
-
202
-
203
-
204
-
205
-
206
-
207
-
208
-
209
-
210
-
211
-
212
 |
 |

134
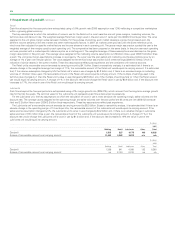
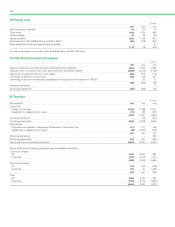
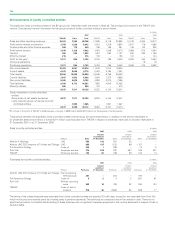
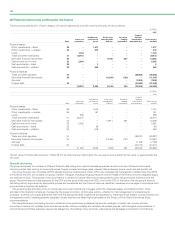
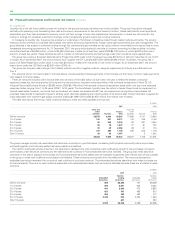
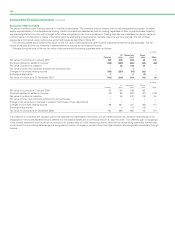
26 Investments in jointly controlled entities
The significant jointly controlled entities of the BP group at 31 December 2007 are shown in Note 46. The principal joint venture is the TNK-BP joint
venture. Summarized financial information for the group’s share of jointly controlled entities is shown below.
$ million
--------------------------------------------------------------------------------------------------------------------------------------------------------------------------------------------------------------------------------------------------------------------------------------------------------
2007 2006 2005
--------------------------------------------------------------------------------------------------------------------------------------------------------------------------------------------------------------------------------------------------------------------------------------------------------
TNK-BP Other Total TNK-BP Other Total TNK-BP Other Total
--------------------------------------------------------------------------------------------------------------------------------------------------------------------------------------------------------------------------------------------------------------------------------------------------------
Sales and other operating revenues 19,463 7,245 26,708 17,863 6,119 23,982 15,122 4,255 19,377
--------------------------------------------------------------------------------------------------------------------------------------------------------------------------------------------------------------------------------------------------------------------------------------------------------
Profit before interest and taxation 3,743 1,299 5,042 4,616 1,218 5,834 3,817 779 4,596
Finance costs and other finance expense 264 176 440 192 169 361 128 104 232
--------------------------------------------------------------------------------------------------------------------------------------------------------------------------------------------------------------------------------------------------------------------------------------------------------
Profit before taxation 3,479 1,123 4,602 4,424 1,049 5,473 3,689 675 4,364
Taxation 993 259 1,252 1,467 260 1,727 976 220 1,196
Minority interest 215 – 215 193 – 193 104 – 104
--------------------------------------------------------------------------------------------------------------------------------------------------------------------------------------------------------------------------------------------------------------------------------------------------------
Profit for the yeara2,271 864 3,135 2,764 789 3,553 2,609 455 3,064
Innovene operations –––––––19
--------------------------------------------------------------------------------------------------------------------------------------------------------------------------------------------------------------------------------------------------------------------------------------------------------
Continuing operations 2,271 864 3,135 2,764 789 3,553 2,609 474 3,083
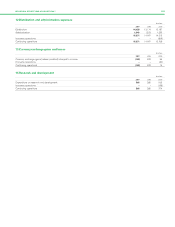
Non-current assets 12,433 9,841 22,274 11,243 7,612 18,855
Current assets 6,073 2,642 8,715 5,403 2,184 7,587
------------------------------------------------------------------------------------------------------------------------------------------------------------------------------------------------------------------------------------
Total assets 18,506 12,483 30,989 16,646 9,796 26,442
------------------------------------------------------------------------------------------------------------------------------------------------------------------------------------------------------------------------------------
Current liabilities 3,547 1,552 5,099 3,594 1,272 4,866
Non-current liabilities 5,562 3,620 9,182 4,226 3,370 7,596
------------------------------------------------------------------------------------------------------------------------------------------------------------------------------------------------------------------------------------
Total liabilities 9,109 5,172 14,281 7,820 4,642 12,462
Minority interest 580 – 580 473 – 473
------------------------------------------------------------------------------------------------------------------------------------------------------------------------------------------------------------------------------------
8,817 7,311 16,128 8,353 5,154 13,507
Group investment in jointly controlled
entities
Group share of net assets (as above) 8,817 7,311 16,128 8,353 5,154 13,507
Loans made by group companies to jointly
controlled entities – 1,985 1,985 – 1,567 1,567
------------------------------------------------------------------------------------------------------------------------------------------------------------------------------------------------------------------------------------
8,817 9,296 18,113 8,353 6,721 15,074
aBP’s share of the profit of TNK-BP in 2006 includes a net gain of $892 million (2005 $270 million) on the disposal of certain assets.
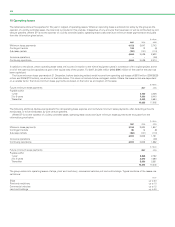
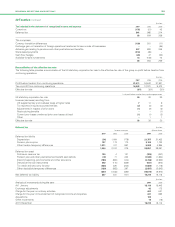
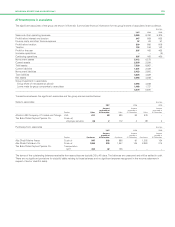
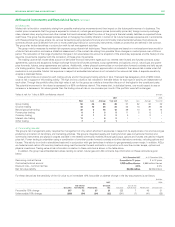
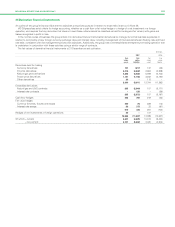
Transactions between the significant jointly controlled entities and the group are summarized below. In addition to the amount receivable at
31 December 2005 shown below, a further $771 million was receivable from TNK-BP in respect of dividends: there was no dividend receivable at
31 December 2007 or at 31 December 2006.
Sales to jointly controlled entities $ million
--------------------------------------------------------------------------------------------------------------------------------------------------------------------------------------------------------------------------------------------------------------------------------------------------------
2007 2006 2005
--------------------------------------------------------------------------------------------------------------------------------------------------------------------------------------------------------------------------------------------------------------------------------------------------------
Amount Amount Amount
receivable at receivable at receivable at
Product Sales 31 December Sales 31 December Sales 31 December
--------------------------------------------------------------------------------------------------------------------------------------------------------------------------------------------------------------------------------------------------------------------------------------------------------
Atlantic 4 Holdings LNG 583 142 227 35 – –
Atlantic LNG 2/3 Company of Trinidad and Tobago LNG 989 137 1,123 99 1,157 –
Pan American Energy Crude oil 240 1 389 – 75 2
Ruhr Oel Employee services 374 539 330 597 169 527
TNK-BP Employee services 150 69 189 99 125 14
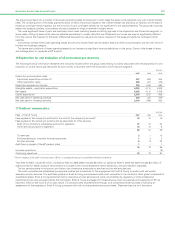
Purchases from jointly controlled entities $ million
--------------------------------------------------------------------------------------------------------------------------------------------------------------------------------------------------------------------------------------------------------------------------------------------------------
2007 2006 2005
--------------------------------------------------------------------------------------------------------------------------------------------------------------------------------------------------------------------------------------------------------------------------------------------------------
Amount Amount Amount
payable at payable at payable at
Product Purchases 31 December Purchases 31 December Purchases 31 December
--------------------------------------------------------------------------------------------------------------------------------------------------------------------------------------------------------------------------------------------------------------------------------------------------------
Atlantic LNG 2/3 Company of Trinidad and Tobago Plant processing
fee/natural gas 241 – 254 – 190 –
Pan American Energy Crude oil 624 2 661 81
Ruhr Oel Refinery operating
costs 902 18 758 32 384 134
TNK-BP Crude oil and oil
products 918 46 2,662 85 908 17
The terms of the outstanding balances receivable from jointly controlled entities are typically 30 to 45 days, except for the receivable from Ruhr Oel,
which will be paid over several years as it relates partly to pension payments. The balances are unsecured and will be settled in cash. There are no
significant provisions for doubtful debts relating to these balances and no significant expense recognized in the income statement in respect of bad or
doubtful debts.
19