BP 2007 Annual Report Download - page 10
Download and view the complete annual report
Please find page 10 of the 2007 BP annual report below. You can navigate through the pages in the report by either clicking on the pages listed below, or by using the keyword search tool below to find specific information within the annual report.-
 1
1 -
 2
2 -
 3
3 -
 4
4 -
 5
5 -
 6
6 -
 7
7 -
 8
8 -
 9
9 -
 10
10 -
 11
11 -
 12
12 -
 13
13 -
 14
14 -
 15
15 -
 16
16 -
 17
17 -
 18
18 -
 19
19 -
 20
20 -
 21
21 -
22
-
23
-
24
-
25
-
26
-
27
-
28
-
29
-
30
-
31
-
32
-
33
-
34
-
35
-
36
-
37
-
38
-
39
-
40
-
41
-
42
-
43
-
44
-
45
-
46
-
47
-
48
-
49
-
50
-
51
-
52
-
53
-
54
-
55
-
56
-
57
-
58
-
59
-
60
-
61
-
62
-
63
-
64
-
65
-
66
-
67
-
68
-
69
-
70
-
71
-
72
-
73
-
74
-
75
-
76
-
77
-
78
-
79
-
80
-
81
-
82
-
83
-
84
-
85
-
86
-
87
-
88
-
89
-
90
-
91
-
92
-
93
-
94
-
95
-
96
-
97
-
98
-
99
-
100
-
101
-
102
-
103
-
104
-
105
-
106
-
107
-
108
-
109
-
110
-
111
-
112
-
113
-
114
-
115
-
116
-
117
-
118
-
119
-
120
-
121
-
122
-
123
-
124
-
125
-
126
-
127
-
128
-
129
-
130
-
131
-
132
-
133
-
134
-
135
-
136
-
137
-
138
-
139
-
140
-
141
-
142
-
143
-
144
-
145
-
146
-
147
-
148
-
149
-
150
-
151
-
152
-
153
-
154
-
155
-
156
-
157
-
158
-
159
-
160
-
161
-
162
-
163
-
164
-
165
-
166
-
167
-
168
-
169
-
170
-
171
-
172
-
173
-
174
-
175
-
176
-
177
-
178
-
179
-
180
-
181
-
182
-
183
-
184
-
185
-
186
-
187
-
188
-
189
-
190
-
191
-
192
-
193
-
194
-
195
-
196
-
197
-
198
-
199
-
200
-
201
-
202
-
203
-
204
-
205
-
206
-
207
-
208
-
209
-
210
-
211
-
212
 |
 |

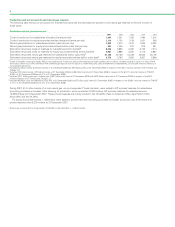
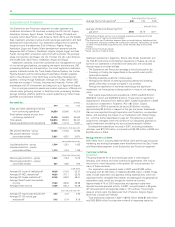
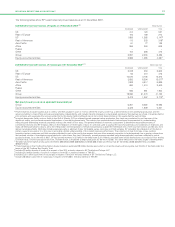
Production and net proved oil and natural gas reserves
The following table shows our production for the past five years and the estimated net proved oil and natural gas reserves at the end of each of
those years.
Production and net proved reservesa
--------------------------------------------------------------------------------------------------------------------------------------------------------------------------------------------------------------------------------------------------------------------------------------------------------
2007 2006 2005 2004 2003
--------------------------------------------------------------------------------------------------------------------------------------------------------------------------------------------------------------------------------------------------------------------------------------------------------
Crude oil production for subsidiaries (thousand barrels per day) 1,304 1,351 1,423 1,480 1,615
Crude oil production for equity-accounted entities (thousand barrels per day) 1,110 1,124 1,139 1,051 506
Natural gas production for subsidiaries (million cubic feet per day) 7,222 7,412 7,512 7,624 8,092
Natural gas production for equity-accounted entities (million cubic feet per day) 921 1,005 912 879 521
Estimated net proved crude oil reserves for subsidiaries (million barrels)b5,492 5,893 6,360 6,755 7,214
Estimated net proved crude oil reserves for equity-accounted entities (million barrels)c4,581 3,888 3,205 3,179 2,867
Estimated net proved natural gas reserves for subsidiaries (billion cubic feet)d41,130 42,168 44,448 45,650 45,155
Estimated net proved natural gas reserves for equity-accounted entities (billion cubic feet)e3,770 3,763 3,856 2,857 2,869
aCrude oil includes natural gas liquids (NGLs) and condensate. Production and proved reserves exclude royalties due to others, whether payable in cash or in kind, where
the royalty owner has a direct interest in the underlying production and the option to make lifting and sales arrangements independently, and include minority interests in
consolidated operations.
bIncludes 20 million barrels (23 million barrels at 31 December 2006 and 29 million barrels at 31 December 2005) in respect of the 30% minority interest in BP Trinidad and
Tobago LLC.
cIncludes 210 million barrels (179 million barrels at 31 December 2006 and 95 million barrels at 31 December 2005) in respect of the 6.51% minority interest in TNK-BP
(6.29% at 31 December 2006 and 4.47% at 31 December 2005).
dIncludes 3,211 billion cubic feet of natural gas (3,537 billion cubic feet at 31 December 2006 and 3,812 billion cubic feet at 31 December 2005) in respect of the 30%
minority interest in BP Trinidad and Tobago LLC.
eIncludes 68 billion cubic feet (99 billion cubic feet at 31 December 2006 and 57 billion cubic feet at 31 December 2005) in respect of the 5.88% minority interest in TNK-BP
(7.77% at 31 December 2006 and 4.47% at 31 December 2005).
During 2007, 414 million barrels of oil and natural gas, on an oil equivalent* basis (mmboe), were added to BP’s proved reserves for subsidiaries
(excluding purchases and sales). After allowing for production, which amounted to 937mmboe, BP’s proved reserves for subsidiaries were
12,583mmboe at 31 December 2007. These proved reserves are mainly located in the US (46%), Rest of Americas (19%), Asia Pacific (10%),
Africa (8%) and the UK (8%).
For equity-accounted entities, 1,168mmboe were added to proved reserves (excluding purchases and sales), production was 470mmboe and
proved reserves were 5,231mmboe at 31 December 2007.
*Natural gas is converted to oil equivalent at 5.8 billion cubic feet (bcf) = 1 million barrels.
8