BP 2007 Annual Report Download - page 123
Download and view the complete annual report
Please find page 123 of the 2007 BP annual report below. You can navigate through the pages in the report by either clicking on the pages listed below, or by using the keyword search tool below to find specific information within the annual report.-
 1
1 -
2
-
3
-
4
-
5
-
6
-
7
-
8
-
9
-
10
-
11
-
12
-
13
-
14
-
15
-
16
-
17
-
18
-
19
-
20
-
21
-
22
-
23
-
24
-
25
-
26
-
27
-
28
-
29
-
30
-
31
-
32
-
33
-
34
-
35
-
36
-
37
-
38
-
39
-
40
-
41
-
42
-
43
-
44
-
45
-
46
-
47
-
48
-
49
-
50
-
51
-
52
-
53
-
54
-
55
-
56
-
57
-
58
-
59
-
60
-
61
-
62
-
63
-
64
-
65
-
66
-
67
-
68
-
69
-
70
-
71
-
72
-
73
-
74
-
75
-
76
-
77
-
78
-
79
-
80
-
81
-
82
-
83
-
84
-
85
-
86
-
87
-
88
-
89
-
90
-
91
-
92
-
93
-
94
-
95
-
96
-
97
-
98
-
99
-
100
-
101
-
102
-
103
-
104
-
105
-
106
-
107
-
108
-
109
-
110
-
111
-
112
-
 113
113 -
 114
114 -
 115
115 -
 116
116 -
 117
117 -
 118
118 -
 119
119 -
 120
120 -
 121
121 -
 122
122 -
 123
123 -
 124
124 -
 125
125 -
 126
126 -
 127
127 -
 128
128 -
 129
129 -
 130
130 -
 131
131 -
 132
132 -
 133
133 -
134
-
135
-
136
-
137
-
138
-
139
-
140
-
141
-
142
-
143
-
144
-
145
-
146
-
147
-
148
-
149
-
150
-
151
-
152
-
153
-
154
-
155
-
156
-
157
-
158
-
159
-
160
-
161
-
162
-
163
-
164
-
165
-
166
-
167
-
168
-
169
-
170
-
171
-
172
-
173
-
174
-
175
-
176
-
177
-
178
-
179
-
180
-
181
-
182
-
183
-
184
-
185
-
186
-
187
-
188
-
189
-
190
-
191
-
192
-
193
-
194
-
195
-
196
-
197
-
198
-
199
-
200
-
201
-
202
-
203
-
204
-
205
-
206
-
207
-
208
-
209
-
210
-
211
-
212
 |
 |

BP ANNUAL REPORT AND ACCOUNTS 2007 121
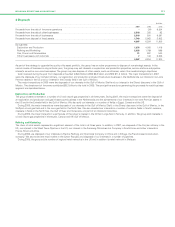
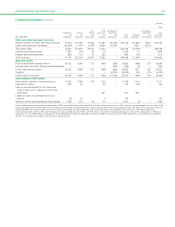
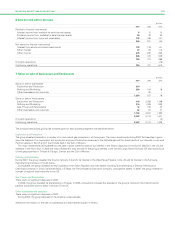
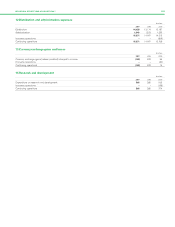
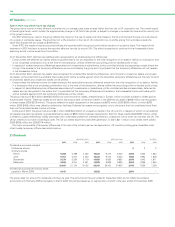
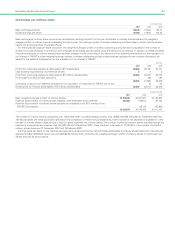
10 Impairment and losses on sale of businesses and fixed assets
$ million
--------------------------------------------------------------------------------------------------------------------------------------------------------------------------------------------------------------------------------------------------------------------------------------------------------
2007 2006 2005
--------------------------------------------------------------------------------------------------------------------------------------------------------------------------------------------------------------------------------------------------------------------------------------------------------
Impairment losses
Exploration and Production 292 137 266
Refining and Marketing 1,186 155 93
Gas, Power and Renewables 40 100 –
Other businesses and corporate 43 69 59
--------------------------------------------------------------------------------------------------------------------------------------------------------------------------------------------------------------------------------------------------------------------------------------------------------
1,561 461 418
--------------------------------------------------------------------------------------------------------------------------------------------------------------------------------------------------------------------------------------------------------------------------------------------------------
Impairment reversals
Exploration and Production (237) (340) –
--------------------------------------------------------------------------------------------------------------------------------------------------------------------------------------------------------------------------------------------------------------------------------------------------------
(237) (340) –
--------------------------------------------------------------------------------------------------------------------------------------------------------------------------------------------------------------------------------------------------------------------------------------------------------
Loss on sale of fixed assets
Exploration and Production 42 195 39
Refining and Marketing 313 228 64
Other businesses and corporate –5
--------------------------------------------------------------------------------------------------------------------------------------------------------------------------------------------------------------------------------------------------------------------------------------------------------
355 428 109
Loss on remeasurement to fair value less costs to sell and on disposal of Innovene operations –184 591
--------------------------------------------------------------------------------------------------------------------------------------------------------------------------------------------------------------------------------------------------------------------------------------------------------
1,679 733 1,118
Innovene operations –(184) (650)
--------------------------------------------------------------------------------------------------------------------------------------------------------------------------------------------------------------------------------------------------------------------------------------------------------
Continuing operations 1,679 549 468
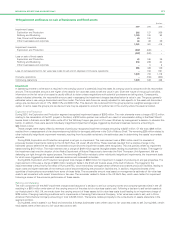
Impairment
In assessing whether a write-down is required in the carrying value of a potentially impaired asset, its carrying value is compared with its recoverable
amount. The recoverable amount is the higher of the asset’s fair value less costs to sell and value in use. Given the nature of the group’s activities,
information on the fair value of an asset is usually difficult to obtain unless negotiations with potential purchasers are taking place. Consequently,
unless indicated otherwise, the recoverable amount used in assessing the impairment charges described below is value in use. The group generally
estimates value in use using a discounted cash flow model. The future cash flows are usually adjusted for risks specific to the asset and discounted
using a pre-tax discount rate of 11% (2006 10% and 2005 10%). This discount rate is derived from the group’s post-tax weighted average cost of
capital. In some cases the group’s pre-tax discount rate may be adjusted to account for political risk in the country where the asset is located.
Exploration and Production
During 2007, the Exploration and Production segment recognized impairment losses of $292 million. The main elements were a charge of $112 million
relating to the cancellation of the DF1 project in Scotland, a $103 million partner loan write-off as a result of unsuccessful drilling in the West Shmidt
licence block in Sakhalin and a $52 million write-off of the Whitney Canyon gas plant in US Lower 48 driven by management’s decision to abandon this
facility. In addition, there were several individually insignificant impairment charges, triggered by downward reserves revisions, amounting to
$25 million in total.
These charges were largely offset by reversals of previously recognized impairment charges amounting to $237 million. Of this total, $208 million
resulted from a reassessment of the decommissioning liability for damaged platforms in the Gulf of Mexico Shelf. The remaining $29 million related to
other individually insignificant impairment reversals, resulting from favourable revisions to the estimates used in determining the assets’ recoverable
amounts.
During 2006, Exploration and Production recognized a net gain on impairment. The main element was a $340 million credit for reversals of
previously booked impairments relating to the UK North Sea, US Lower 48 and China. These reversals resulted from a positive change in the
estimates used to determine the assets’ recoverable amount since the impairment losses were recognized. This was partially offset by impairment
losses totalling $137 million. The major element was a charge of $109 million against intangible assets relating to properties in Alaska. The trigger for
the impairment test was the decision of the Alaska Department of Natural Resources to terminate the Point Thompson Unit Agreement. We are
defending our right through the appeal process. The remaining $28 million relates to other individually insignificant impairments, the impairment tests
for which were triggered by downward reserves revisions and increased tax burden.
During 2005, Exploration and Production recognized total charges of $266 million for impairment in respect of producing oil and gas properties. The
major element of this was a charge of $226 million relating to fields in the Shelf and Coastal areas of the Gulf of Mexico. The triggers for the
impairment tests were primarily the effect of Hurricane Rita, which extensively damaged certain offshore and onshore production facilities, leading to
repair costs and higher estimates of the eventual cost of decommissioning the production facilities and, in addition, reduced estimates of the
quantities of hydrocarbons recoverable from some of these fields. The recoverable amount was based on management’s estimate of fair value less
costs to sell consistent with recent transactions in the area. The remainder related to fields in the UK North Sea, which were tested for impairment
following a review of the economic performance of these assets.
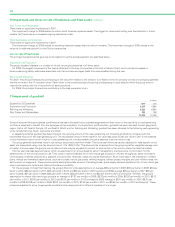
Refining and Marketing
The main component of the 2007 impairment charge arose because of a decision to sell our company-owned and company-operated sites in the US
resulting in a $610 million write-down of the carrying amount of the sites to fair value less costs to sell. Following a decision to sell certain assets at
our Acetyls plant in Hull, UK, we wrote down the carrying amount of these assets to fair value less costs to sell leading to an impairment charge of
$186 million. Changing marketing conditions led to impairments in Samsung Petrochemical Company, to fair value less costs to sell, and in China
American Petrochemical Company amounting in total to $165 million. The balance relates principally to the write-downs of assets elsewhere in the
segment portfolio.
During 2006, certain assets in our Retail and Aromatics & Acetyls businesses were written down to fair value less costs to sell. During 2005, certain
retail assets were written down to fair value less costs to sell.
6