BP 2007 Annual Report Download - page 40
Download and view the complete annual report
Please find page 40 of the 2007 BP annual report below. You can navigate through the pages in the report by either clicking on the pages listed below, or by using the keyword search tool below to find specific information within the annual report.-
 1
1 -
2
-
3
-
4
-
5
-
6
-
7
-
8
-
9
-
10
-
11
-
12
-
13
-
14
-
15
-
16
-
17
-
18
-
19
-
20
-
21
-
22
-
23
-
24
-
25
-
26
-
27
-
28
-
29
-
 30
30 -
 31
31 -
 32
32 -
 33
33 -
 34
34 -
 35
35 -
 36
36 -
 37
37 -
 38
38 -
 39
39 -
 40
40 -
 41
41 -
 42
42 -
 43
43 -
 44
44 -
 45
45 -
 46
46 -
 47
47 -
 48
48 -
 49
49 -
 50
50 -
51
-
52
-
53
-
54
-
55
-
56
-
57
-
58
-
59
-
60
-
61
-
62
-
63
-
64
-
65
-
66
-
67
-
68
-
69
-
70
-
71
-
72
-
73
-
74
-
75
-
76
-
77
-
78
-
79
-
80
-
81
-
82
-
83
-
84
-
85
-
86
-
87
-
88
-
89
-
90
-
91
-
92
-
93
-
94
-
95
-
96
-
97
-
98
-
99
-
100
-
101
-
102
-
103
-
104
-
105
-
106
-
107
-
108
-
109
-
110
-
111
-
112
-
113
-
114
-
115
-
116
-
117
-
118
-
119
-
120
-
121
-
122
-
123
-
124
-
125
-
126
-
127
-
128
-
129
-
130
-
131
-
132
-
133
-
134
-
135
-
136
-
137
-
138
-
139
-
140
-
141
-
142
-
143
-
144
-
145
-
146
-
147
-
148
-
149
-
150
-
151
-
152
-
153
-
154
-
155
-
156
-
157
-
158
-
159
-
160
-
161
-
162
-
163
-
164
-
165
-
166
-
167
-
168
-
169
-
170
-
171
-
172
-
173
-
174
-
175
-
176
-
177
-
178
-
179
-
180
-
181
-
182
-
183
-
184
-
185
-
186
-
187
-
188
-
189
-
190
-
191
-
192
-
193
-
194
-
195
-
196
-
197
-
198
-
199
-
200
-
201
-
202
-
203
-
204
-
205
-
206
-
207
-
208
-
209
-
210
-
211
-
212
 |
 |

38
We are developing a new silicon growth process named Mono
22
,
which significantly increases cell efficiency over traditional
multicrystalline-based solar cells, making our first pilot shipment in 2007.
Solar cells made with these wafers, in combination with other BP Solar
advances in cell process technology, are expected to be able to produce
between 5% and 8% more power than solar cells made with
conventional processes. We are working with a number of research
universities and institutes including the California Institute of Technology
in the US where we are pursuing nanotube solar installations. This
represents another step improvement in cost and efficiency. In Germany,
we signed a co-operation agreement with the Institute of Crystal Growth
(IKZ) in September 2006 to develop a technique to deposit silicon in very
thin layers directly on glass instead of growing crystals. The programme
has demonstrated this ability and work continues to improve the growth
process and crystal structure. We are participating in a $40-million
research and development programme (of which $20 million is provided
by BP Solar) aimed at decreasing the cost of solar cells and increasing
their efficiency. The programme is sponsored by the US Department of
Energy.
Wind
Since 2005, we have increased our wind capacity from 32MW to more
than 370MW, with an aim to grow that to more than 1,000MW by the
end of 2008. We operate wind farms in the Netherlands, Maharashtra in
India and Colorado in the US.
In the US, we have a long-term supply agreement with Clipper
Windpower plc, with options to purchase Clipper turbines with a total
capacity of 2,250MW. During 2006, we also acquired Orion Energy, LLC,
and Greenlight Energy, Inc. With the acquisition of these large-scale wind
energy developers, our North American wind portfolio includes projects
with potential total generating capacity of some 15,000MW. During
2007, we commenced construction on the Silver Star I project (60MW) in
Texas and commenced full commercial operation of our 300MW Cedar
Creek project in Colorado.
In India, we commenced full commercial operations at our 40MW
wind farm in Dhule, Maharashtra, India using 32 turbines supplied and
installed by Suzlon, each with the capacity to generate 1.25MW of
electricity.
Gas-fired power
Gas-fired power stations typically emit around half as much CO
2
as
conventional coal-fired plants. We have interests in a 785MW gas-fired
power generation facility and an associated LNG re-gasification facility at
Bilbao, Spain (BP 25% share in each), a 1,074MW gas-fired combined
cycle power (CCGT) plant at Kwangyang, South Korea (BP 35%), a
724MW CCGT facility at Phu My, Vietnam (BP 33.3%), a 1,378MW gas
turbine (BP 10%) in Trinidad & Tobago, a 392MW co-generation plant
(BP 51%) in California, US and a 744MW co-generation plant at Texas
City, US (BP 50%), which supplies power and steam to BP’s largest
refining and petrochemicals complex. Also, a 50MW combined heat and
power plant near Southampton, UK (BP 100%) has been in operation
since the first half of 2005. Construction continues on the 250MW steam
turbine power generating plant at the Texas City refinery site, which is
expected to bring the total capacity of the site to around 1,000MW when
completed in 2008.
Hydrogen power
In May 2007, BP and Rio Tinto announced the formation of a new jointly
owned company, Hydrogen Energy, which will develop decarbonized
energy projects around the world. The venture will initially focus on
hydrogen-fuelled power generation, using fossil fuels and CCS
technology to produce new large-scale supplies of clean electricity.
We are developing industrial-scale hydrogen power projects with CCS
technology.
General Electric and BP have formed a global alliance to jointly develop
and deploy technology for hydrogen power plants that could significantly
reduce emissions of the greenhouse gas CO
2
from electricity generation.
Other businesses and corporate
Other businesses and corporate comprises Treasury (which includes all
the group’s cash, cash equivalents and associated interest income), the
group’s aluminium asset and corporate activities worldwide.
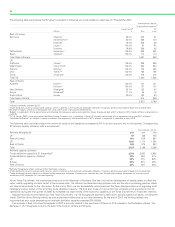
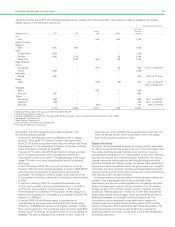
Key statistics $ million
------------------------------------------------------------------------------------------------------------------------------------------------
2007 2006 2005
------------------------------------------------------------------------------------------------------------------------------------------------
Sales and other operating revenues
for continuing operations 843 1,009 668
Profit (loss) before interest and tax
from continuing operationsa(1,128) (885) (1,237)
Total assets 17,188 14,184 12,144
Capital expenditure and acquisitions 275 281 817
aIncludes profit after interest and tax of equity-accounted entities.
Resegmentation in 2008
With effect from 1 January 2008:
– The Alternative Energy business was transferred from the Gas, Power
and Renewables segment to Other businesses and corporate.
– The Emerging Consumers Marketing Unit was transferred from
Refining and Marketing to Alternative Energy (which is reported in
Other businesses and corporate).
– The Biofuels business was transferred from Refining and Marketing to
Alternative Energy (which is reported in Other businesses and
corporate).
– The Shipping business was transferred from Refining and Marketing
to Other businesses and corporate.
Treasury
Treasury co-ordinates the management of the group’s major financial
assets and liabilities. From locations in the UK, the US and the Asia
Pacific region, it provides the link between BP and the international
financial markets and makes available a range of financial services to the
group, including supporting the financing of BP’s projects around the
world.
Aluminium
Our aluminium business is a non-integrated producer and marketer of
rolled aluminium products, headquartered in Louisville, Kentucky, US.
Production facilities are located in Logan County, Kentucky, and are
jointly owned with Novelis. The primary activity of our aluminium
business is the supply of aluminium coil to the beverage can business,
which it manufactures primarily from recycled aluminium.
Research, technology and engineering
Research, technology and engineering activities are carried out by each
of the major business segments on the basis of a distributed programme
co-ordinated by a technology co-ordination group. This body provides
leadership for scientific, technical and engineering activities throughout
the group and in particular promotes cross-business initiatives and the
transfer of best practice between businesses. In addition, a group of
eminent industrialists and academics forms the Technology Advisory
Council, which advises senior management on the state of technology
within the group and helps to identify current trends and future
developments in technology.
Research and development is carried out using a balance of internal
and external resources. Involving third parties in the various steps of
technology development and application enables a wider range of
technology solutions to be considered and implemented, improving the
productivity of research and development activities. External resources
includes investing in technology ventures as a platform for promoting
collaborative research. These ventures are not subsidiaries and, as a
result, their expenditure on research and development is not included
directly in the research and development expenditure stated below.
Across the group, expenditure on research and development for 2007
was $566 million, compared with $395 million in 2006 and $502 million in